Splines

· 20 min read

TLDR Splines are smooth curves defined by piecewise polynomials, widely used in data visualization. Different types of splines have distinct characteristics: Bezier curves are easy to use but lack local control at higher orders; Hermite curves are based on physically meaningful velocity vectors; Cardinal and Catmull-Rom curves pass directly through control points; B-Splines achieve C² continuity while maintaining local control capability. Continuity (C^n and G^n) affects the smoothness and visual appearance of curves. For data visualization, choosing appropriate spline curves can balance accuracy and reduce visual illusions.

2D Graphic Collision

· 9 min read

TLDR
This article introduces various 2D collision detection methods: from basic Axis-Aligned Bounding Boxes (AABB) and circular collision, to Oriented Bounding Boxes (OBB) and the Welzl algorithm for minimum enclosing circles; from the Separating Axis Theorem (SAT) for convex polygons, to precise pixel-level collision detection; finally covering performance optimization through Hierarchical Bounding Boxes (HBB) and spatial partitioning methods like quadtrees. Different methods are suitable for different scenarios, providing solutions for collision detection from simple geometric shapes to complex irregular figures.

Fluid Simulator

· 14 min read

TLDR
There are two classic methods for fluid simulation: the Eulerian method and the Lagrangian method. This article will provide a detailed explanation of the principles and implementation of both approaches.

DOS2 Mod Chinese Localization

· 9 min read

TLDR

This article provides a detailed guide on how to localize Odinblade's series of class MODs for DOS2 into Chinese. The main steps include:

  1. Using LSLib Toolkit to unpack the MOD's PAK files
  2. Locating and translating localization files in the MOD, including content in Public/Localization and Mods/Localization
  3. Using The Divinity Engine2 editor for deeper localization work, handling text not included in standard localization files
  4. Repackaging and publishing the localization MOD

Through this method, the author successfully provided complete Chinese localization support for Odinblade's series of class MODs, gaining approximately 3000 subscribers.

Eyes Tracking

· 5 min read

TLDR

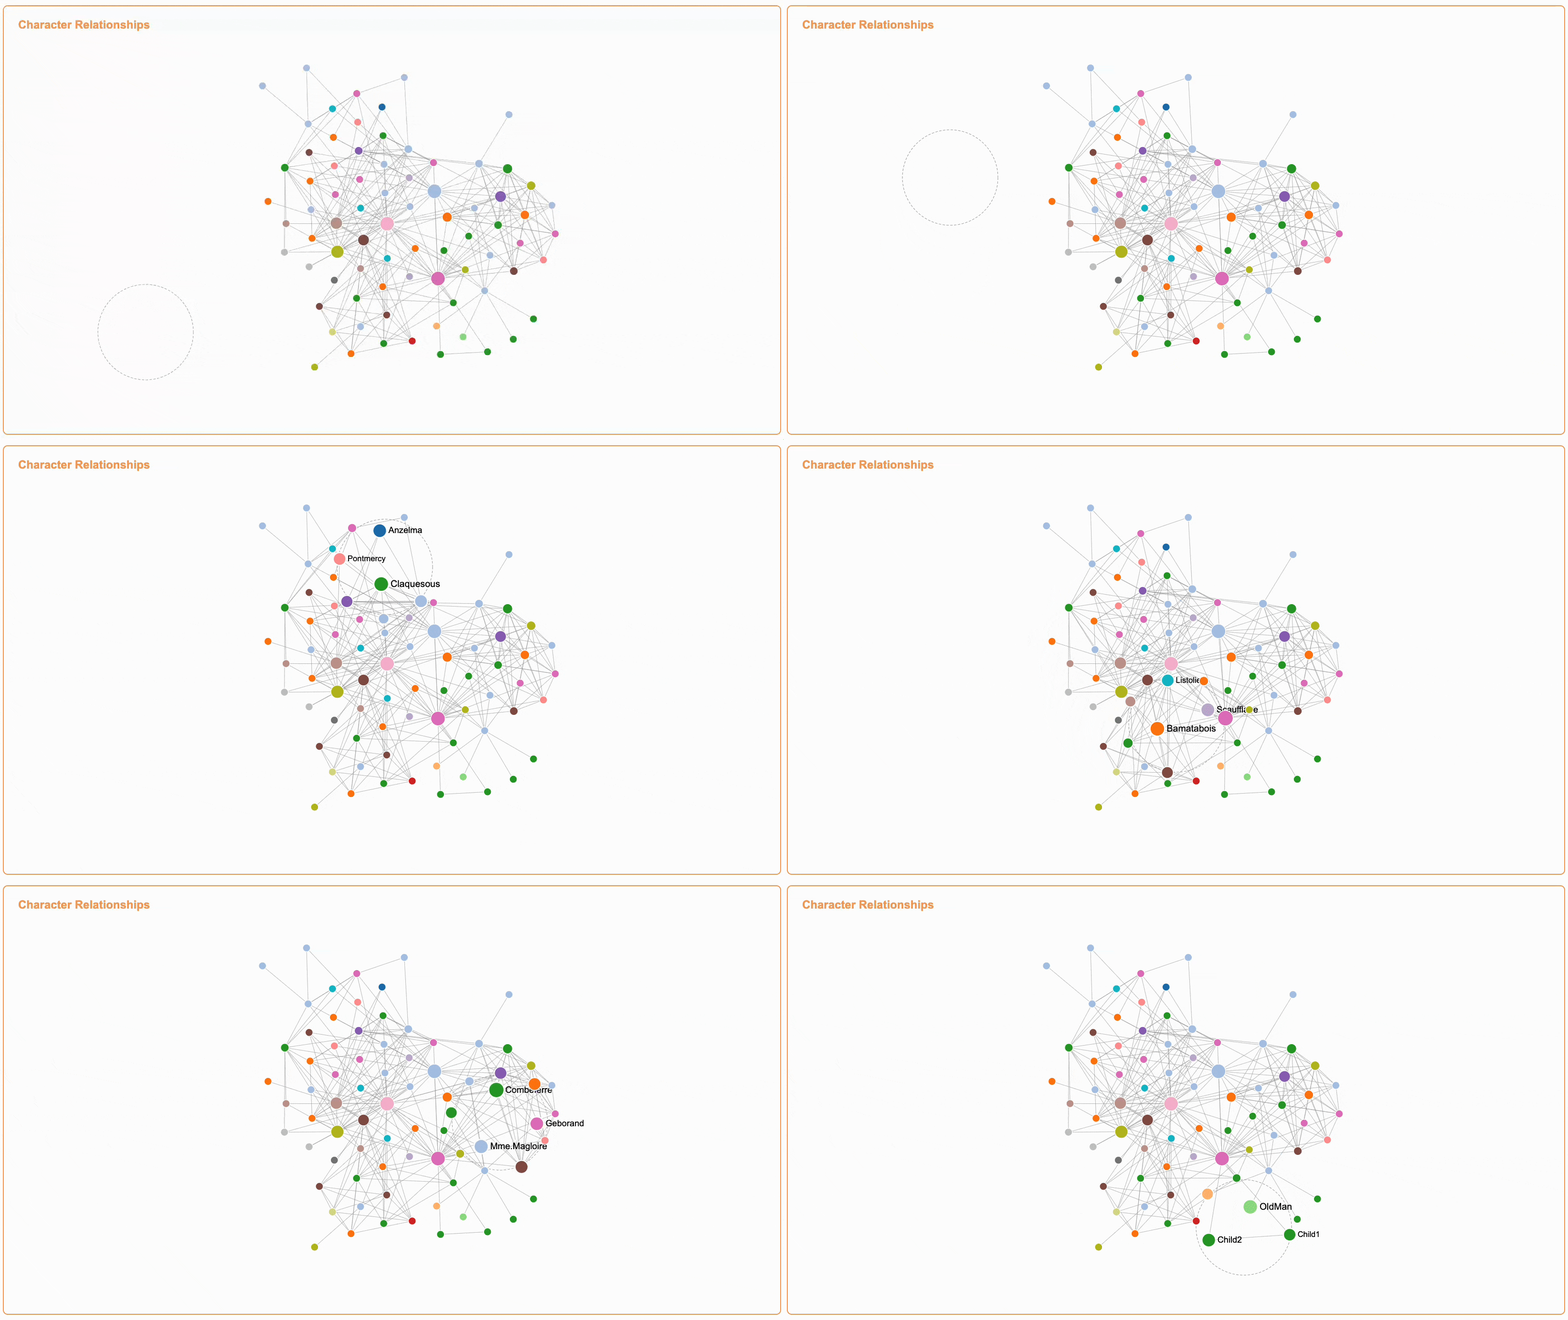
This article explores a new interaction method for complex network visualizations that combines fisheye distortion with eye tracking technology. The approach allows users to naturally explore dense node-link diagrams by controlling the fisheye effect with their gaze, while keeping the mouse available for other interactions. This is particularly useful for organizational relationship visualizations where users need to switch between overview and detailed views of specific connections.

eyesTrack

Research on GAAS

· 8 min read

TLDR

This article explores the gaming industry's evolution and current state. It examines key metrics showing the industry's massive scale ($240 billion) and rapid growth, with 3.42 billion gamers worldwide and revenues of $187.7 billion in 2024. The article traces the industry's transformation from a simple three-part structure (developers, publishers, platforms) to today's vertically integrated ecosystems dominated by major players like Sony, Nintendo, and Microsoft. It analyzes how subscription models have become a dominant revenue stream, similar to Netflix's impact on entertainment. The piece concludes by discussing mobile gaming's rise due to accessibility and fragmented gaming experiences, while predicting virtual reality headsets as the next major platform evolution once they overcome current technical barriers.

Enhance Dataviz via ControlNet-Canny

· 4 min read

TLDR This article explores how to enhance data visualization using ControlNet-Canny, inspired by historical Zoomorphic Maps. By leveraging AI tools like ComfyUI and ControlNet, we can infuse charts with thematic elements while preserving their data integrity, creating more engaging and contextually relevant visualizations. The experiment demonstrates a modern approach to an age-old cartographic technique of making data more expressive and meaningful through creative visual representation.

Pixelated Art

· 14 min read

TLDR This article documents my experimental attempt at creating pixel art animations using AI tools. Through exploring different approaches like ComfyUI, I tried to generate character sprite sheets for a simple running animation. While the results are still preliminary and face several challenges, this experiment provides some insights into combining AI with pixel art creation. The article shares my learning process and the technical workflow I developed, hoping it might be helpful for others interested in similar experiments.

Paper Reading Automation Shape the Process of Narrative Visualization

· 9 min read

TLDR

The study investigates the involvement of automation in narrative visualization tools, summarizing six genres: annotated charts, infographics, timelines & storylines, data comics, scrollytelling & slideshow, and data videos. It categorizes four types of tools:design spaces, authoring tools, ML/AI-supported tools, and ML/AI-generator tools according to their intelligence and automation levels. By surveying 105 papers and tools, the study explores how automation can progressively engage in visualization design and narrative processes to aid users in creating narrative visualizations. It aims to provide an overview of current research and development, identifies key research problems in each category, and suggests opportunities for further investigation in this domain.

AI-Review

· 9 min read

TLDR

This article provides a comprehensive overview of artificial intelligence (AI), covering its fundamental concepts, historical development, and key milestones. Starting with a basic definition of intelligence as a system that maps inputs to specific outputs, it explores important events like the 1956 Dartmouth Conference that established AI as an academic field, and the emergence of connectionism in 1958 which introduced neural network approaches. The article includes detailed explanations, diagrams, and mathematical concepts to help understand AI's theoretical foundations and practical implementations.

ECharts Morph Transition

· 15 min read

TLDR

This article explores how ECharts implements morphing transitions between different shapes. We'll examine the core implementation in the source code, breaking down the process into key steps including path conversion, structure alignment, and optimal rotation calculation. Through this analysis, we'll understand how ECharts achieves smooth shape transformations while maintaining visual continuity.

Extending ECharts Global Roaming

· 12 min read

TLDR

This article explores how to extend ECharts' global roaming functionality. While ECharts provides roaming through dataZoom for Cartesian charts, relationship-type charts lack full global roaming support. We'll examine ECharts' current single-series roaming implementation and develop a solution to enable global roaming across all chart types.

Paper Reading LIDA

· 7 min read

TLDR

LIDA is a novel tool for generating grammar-agnostic visualizations and infographics. It addresses several key challenges in automatic visualization creation:

  1. Understanding data semantics
  2. Enumerating visualization goals
  3. Generating visualization specifications

The system uses a multi-stage pipeline powered by large language models (LLMs) and image generation models (IGMs). It consists of 4 main modules:

  1. SUMMARIZER: Converts data into compact natural language summaries
  2. GOAL EXPLORER: Identifies potential visualization goals based on the data
  3. VISGENERATOR: Handles visualization code generation, refinement and filtering
  4. INFOGRAPHER: Creates data-driven stylized graphics using IGMs

LIDA provides both a Python API and an interactive user interface supporting direct manipulation and multilingual natural language for generating charts, infographics and data stories.

ECharts Overview

· 9 min read

TLDR

In the past two years, my work has involved building chart components based on ECharts. This experience has given me a fundamental understanding of visualization component libraries. This article primarily introduces ECharts from the perspectives of timeline, feature and architecture.

Paper Reading DMap

· 3 min read

TLDR

This article contains my notes from the paper "D-Map: Visual Analysis of Ego-centric Information Diffusion Patterns in Social Media". I'll discuss how the paper proposes a visualization method to analyze information propagation patterns on social media platforms, with a focus on the D-Map layout algorithm that transforms force-directed graphs into honeycomb diagrams.

Paradox of Probability Theory

· 7 min read

TLDR

This article explores three fascinating paradoxes in probability theory that challenge our intuitive understanding. First, we examine the Monty Hall Problem, which demonstrates how switching doors in a game show can counter-intuitively double your chances of winning. Next, we look at the Inspection Paradox through a medical testing scenario, showing how a highly accurate test can still lead to misleading conclusions when base rates are considered. Finally, we investigate Simpson's Paradox using a hospital comparison case, revealing how aggregated statistics can sometimes paint a completely different picture than when examining individual components.

Color Space

· 7 min read

TLDR

This article explores the concept of color spaces, their diversity, and characteristics. It delves into the foundational CIE 1931 color space, which serves as the reference standard for all other color spaces. Through interactive visualizations and video explanations, we'll examine how different color spaces are defined and their practical implications in color representation and reproduction.

Paper Reading TimeOntheHorzon

· One min read

TLDR

This article contains my notes from the paper "Time on the Horizon: A New Visual Design for Time-Series Data". I'll discuss the problem statement, the evaluation criteria, the authors' approach, and the case study.