Eyes Tracking
TLDR
This article explores a new interaction method for complex network visualizations that combines fisheye distortion with eye tracking technology. The approach allows users to naturally explore dense node-link diagrams by controlling the fisheye effect with their gaze, while keeping the mouse available for other interactions. This is particularly useful for organizational relationship visualizations where users need to switch between overview and detailed views of specific connections.

Introduction
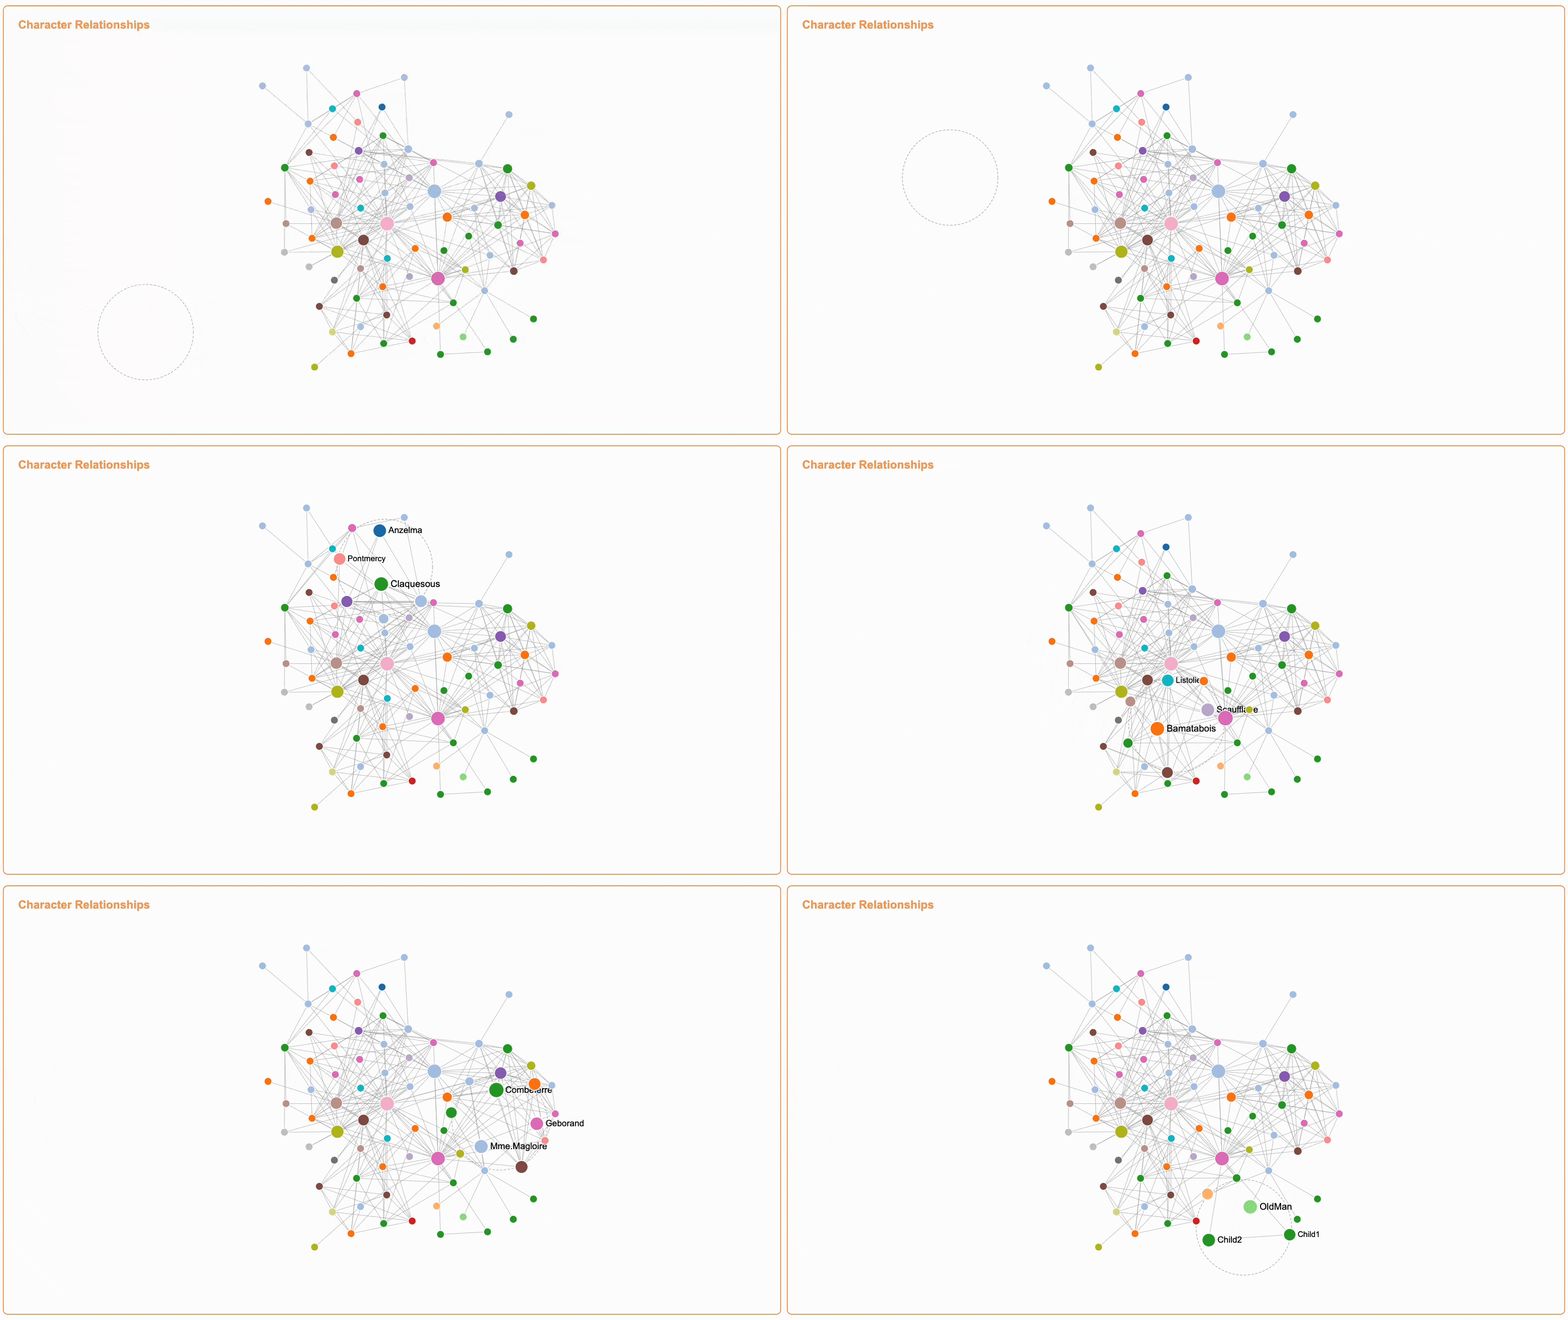
Throughout my career, I have frequently encountered visualization scenarios similar to those depicted in the image, particularly in cases like "organizational relationship visualization." In such visualizations, the main graph typically contains numerous nodes and edges, with users able to focus on specific areas through zooming and panning operations. When a user clicks on a node, that node and its associated connections are highlighted, while corresponding detailed information is displayed in auxiliary views like sub-graphs and detail panels on the side.

A persistent challenge I've observed is that while the main graph's dense network of nodes and edges provides a good macro-level overview, it makes it difficult to examine the intricate relationships between individual nodes. Although various techniques like clustering and edge bundling can improve the visualization's clarity, they still don't offer a fully intuitive way to explore these relationships.
 Recently, I've discovered two new technologies to me that could significantly enhance the interaction experience for such relationship diagrams, particularly in relational graph. The first is AntV's component called
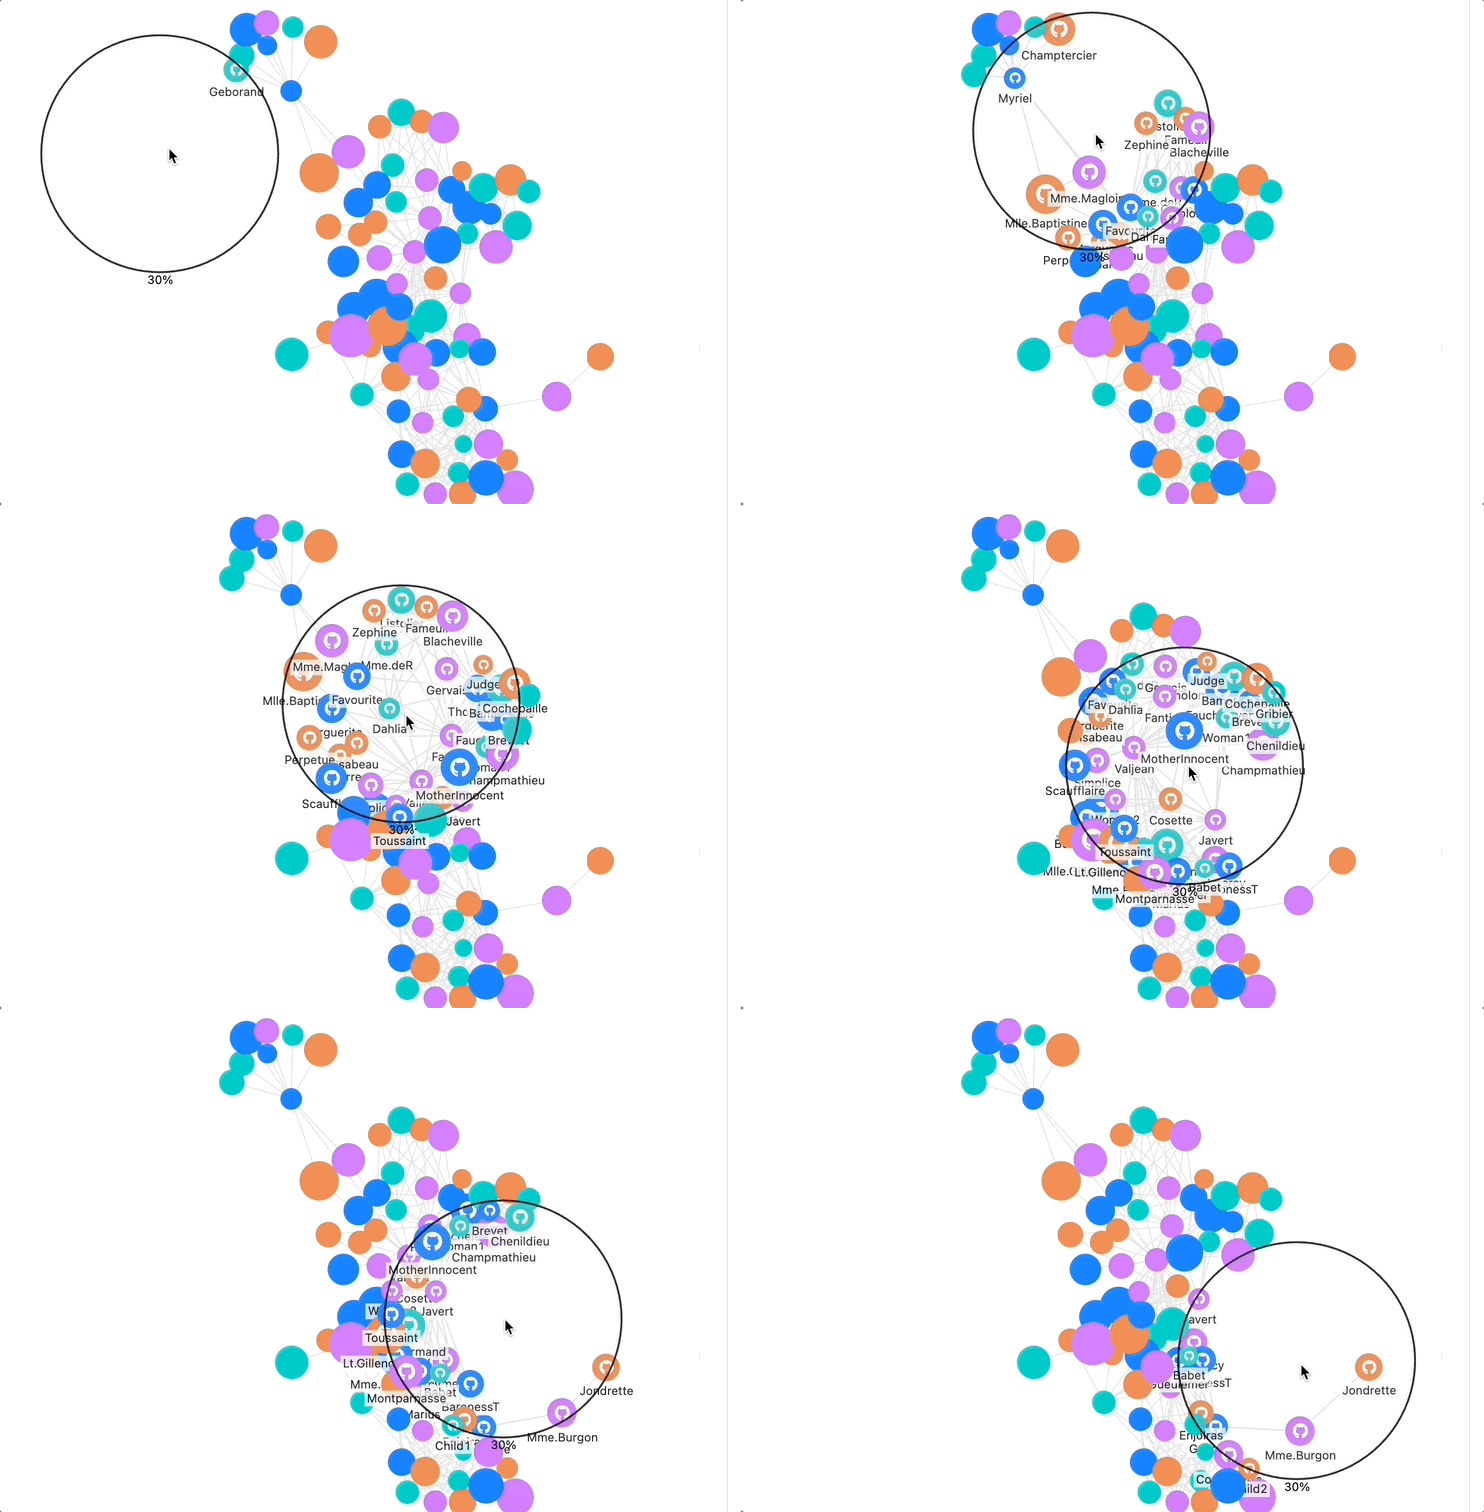
 fisheye, which enables users to magnify specific portions of the relationship graph to reveal hidden nodes and edges. The second is eye tracking technology.

Upon discovering these two technologies, I naturally thought of combining them: using eye tracking to control the fisheye effect while preserving AntV's existing mouse-based interactions. In this enhanced interaction model, eye tracking would control the fisheye in the main graph, improving the experience of exploring complex multi-graph linkages. Meanwhile, the mouse remains free for other interactions, such as selecting bars in auxiliary charts to highlight corresponding nodes in the main graph. The fisheye effect would automatically activate wherever the user's gaze falls on the main graph, creating a more natural and intuitive exploration experience.
Demo
Eye Tracking Visualization Guide
For better experience, you can open this demo in a new window by clicking the button below. This will give you more screen space and better performance.
-
Initial Setup
- Allow camera access when prompted
- Wait for eye tracking initialization
- Ensure good lighting and face visibility
-
Eye Tracking Process
- Click "Start Eye Tracking" button when ready
- Complete the calibration process if no saved calibration data
- System will automatically load previous calibration if available
- Use "Clear Saved Calibration" button if tracking seems inaccurate
- Click "Stop Eye Tracking" to end the session
-
Main Visualization Features
- Character relationship graph (left panel)
- Top 5 first letters statistics (right top)
- Control panel (right bottom)
-
Interaction Methods
- Use your eyes to trigger fisheye effect in eye tracking mode
- Switch to mouse tracking mode for mouse-based interaction
- Hover over nodes to see character names
- Drag nodes to adjust graph layout
- Mouse over bars to highlight related characters
-
Visual Feedback
- Fisheye lens follows your gaze/mouse position
- Nodes and text enlarge when looked at/hovered over
- Connected relationships are emphasized
- Bar chart highlights related nodes when interacted with
-
Tips
- Maintain stable head position during calibration
- Use "Clear Saved Calibration" if tracking becomes inaccurate
- Switch to mouse tracking mode if needed
- Stop eye tracking before closing the page
Initially, I used the WebGazer.js visual tracking library. However, its default tracking mode uses the mouse position as an auxiliary calibration point, leading to significant tracking discrepancies when your mouse is on the right side of the panel while you are looking at the main graph on the left. Later, I switched to GazeRecorder, which greatly improved the results. Unfortunately, GazeRecorder cannot be used commercially as it isn't fully open-source; it is an SDK open for free trials for researchers only.
This was a very interesting experiment for me, as it worked as expected in the interactive scenarios I envisioned. Additionally, I replicated AntV's fishEye component in D3.js and gained a foundational understanding of its transformation algorithm.
In the future, I might need to return to WebGazer.js and tweak its parameters to achieve results similar to GazeRecorder. But for now, I'll leave it as it is.

The effects shown in the image above are controlled by mouse movement.