Stanford CS448B 12 Animation
TLDR
This article contains my notes from Stanford's CS448B (Data Visualization) course, specifically focusing on the twelfth lecture about animation. I'll discuss the importance of animation in data visualization, the principles behind it, and explore various techniques for visualizing data, including the use of guides, expressiveness, effectiveness, support for comparison and pattern perception, grouping and sorting data, transforming data, reducing cognitive overhead, and consistency. I'll also cover various chart types, such as line charts, bar charts, stacked area charts, and others, providing examples and discussing their design considerations.
Original
Notes
Forward Thinking
- For the final project, do you have a recommendation of a place to go to view other datavisualization research papers that conducted user studies?
- As animations contain more and more data, is it possible that we can overload or overstimulate the user? Can animations be harmful by being too distracting? If so, how can we safeguard our designs to make sure they don't cause this overstimulation?
- Is there a more formal or mathematical rule set governing which colors to use to highlight information, and which to contrast? Or is it mostly a combination of multiple factors that you need to see to know? In a similar vein, do colors need to be different in shade as well as color for black and white printing? How do we know to vary transparency with color or just color?
- How seriously should we take self-reported stated preferences when evaluating the strength of a visualization? How much should we weight user’s expressed preference relative to usability, learning, and recall data when evaluating the efficacy of a visualization?
Why Use Motion
The goal of visualization is to convey information
How does animation help convey information?
Cone Trees


- Visual variable to encode data
- Direct attention
- Understand system dynamics
- Understand state transition
- Increase engagement
Understanding Motion
-
Pre-attentive:Stronger than color, shape, ...
-
Triggers an orientation response
-
Motion parallax provides 3D cue
-
More sensitive to motion at periphery
-
Grouping based on biological motion

-
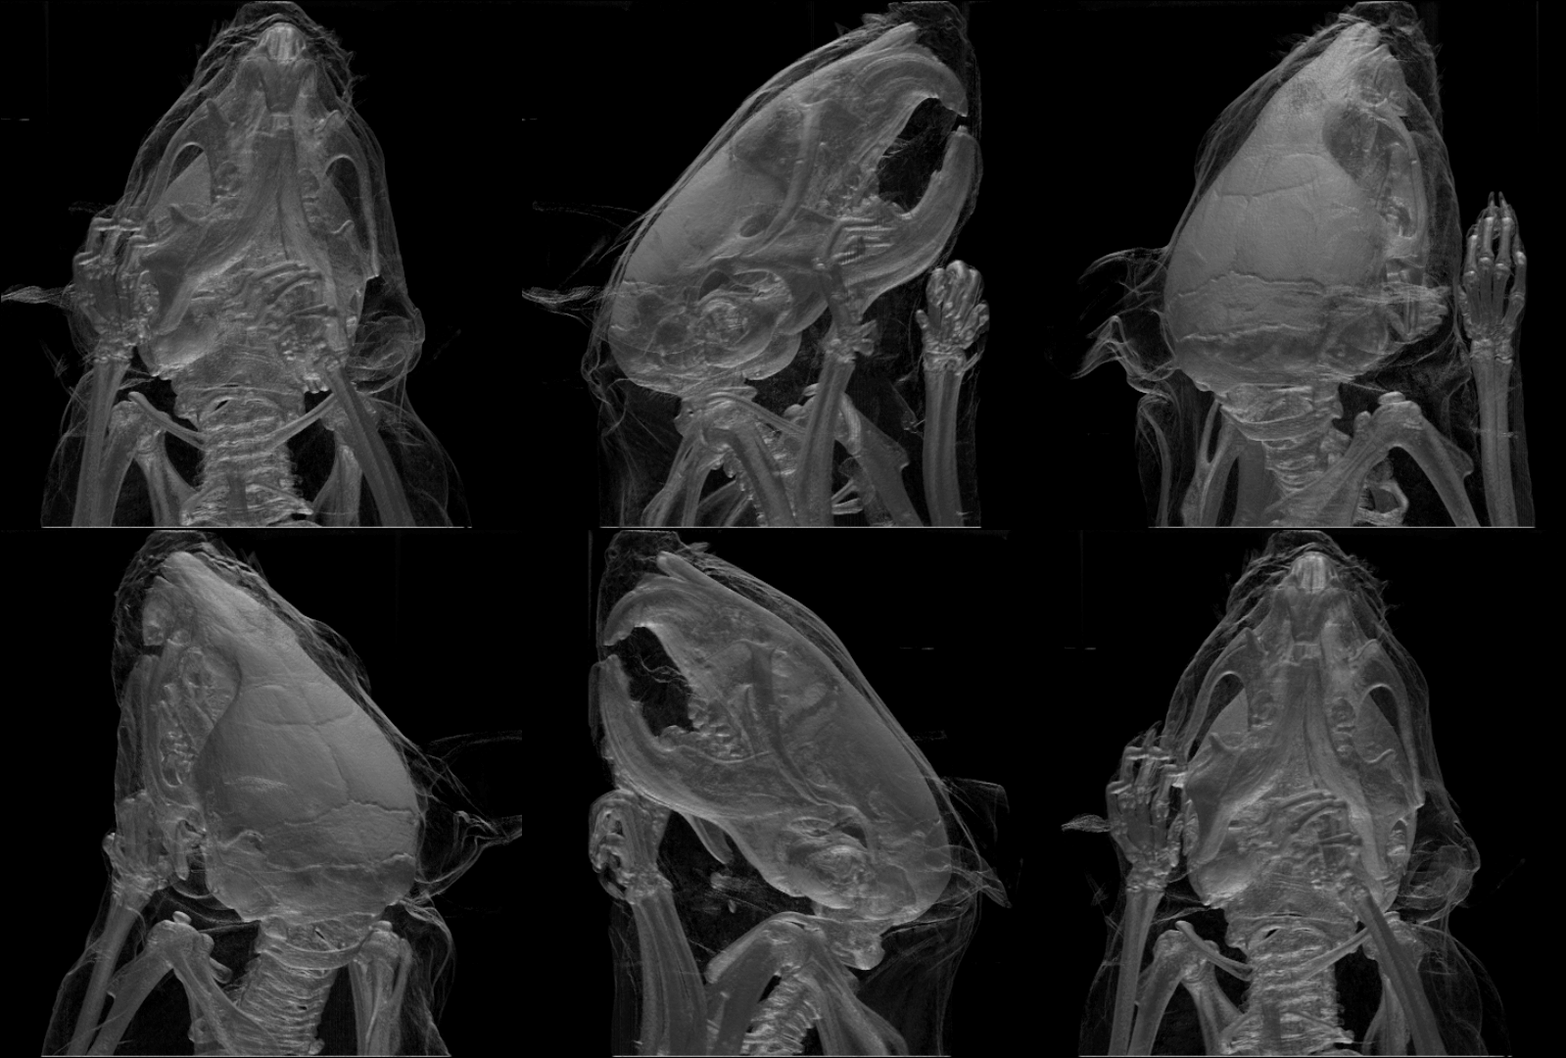
Volume rendering
-
Tracking multiple targets
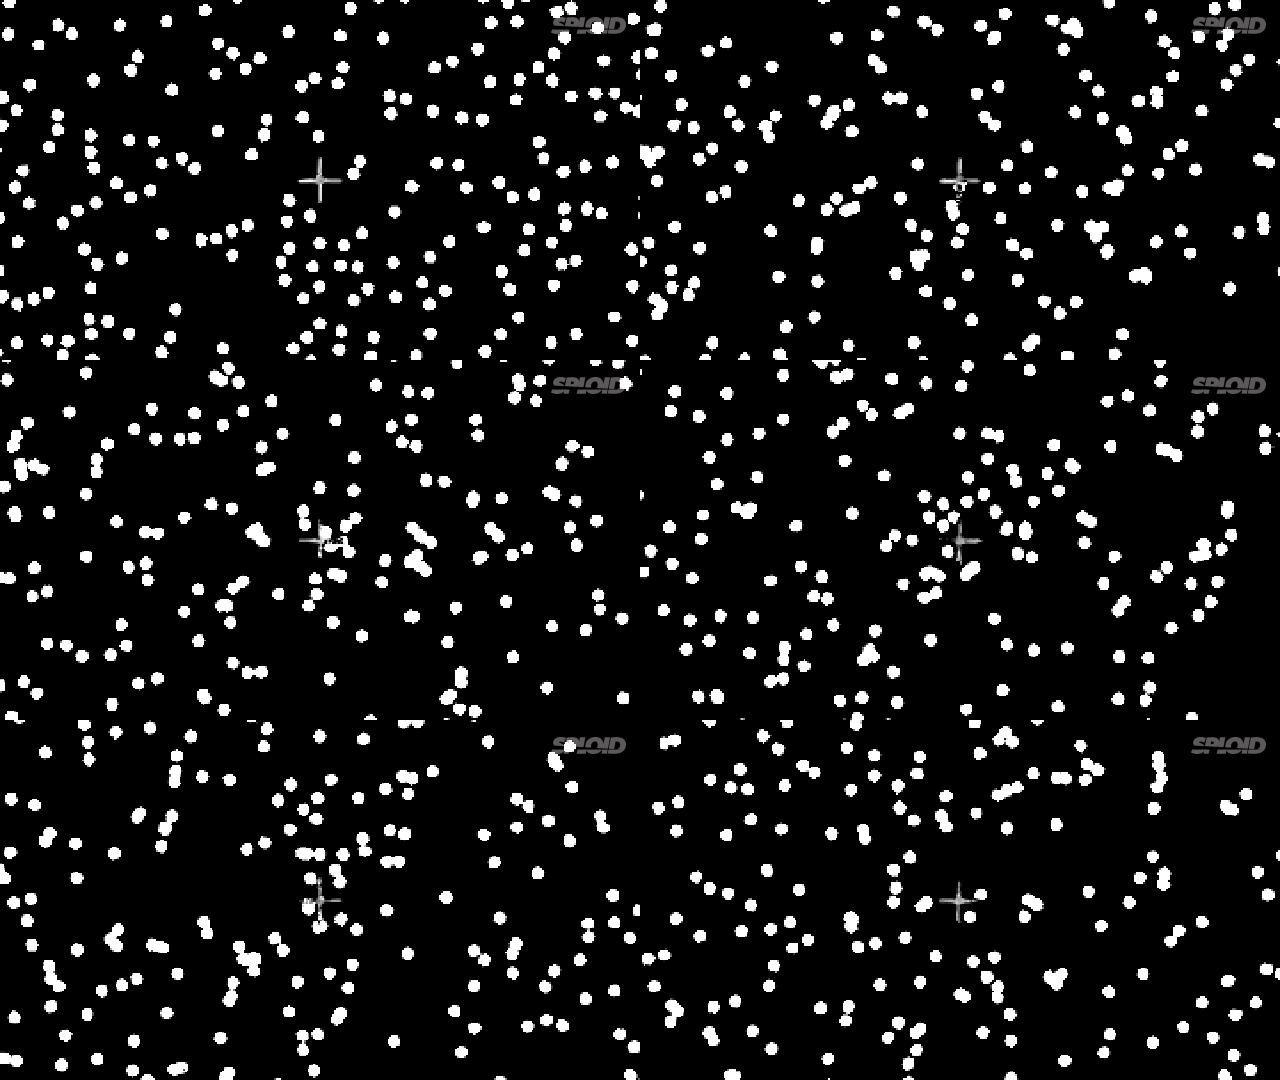
How many dots can we simultaneously track?
4 to 6 - difficulty increases significantly at 6
Motions directly show transitions
Can see change from one state to next?
- States are spatial layouts
- Changes are simple transitions (mostly translations)

Shows transition better, but
- Still may be too fast, or too slow
- Too many objects may move at once
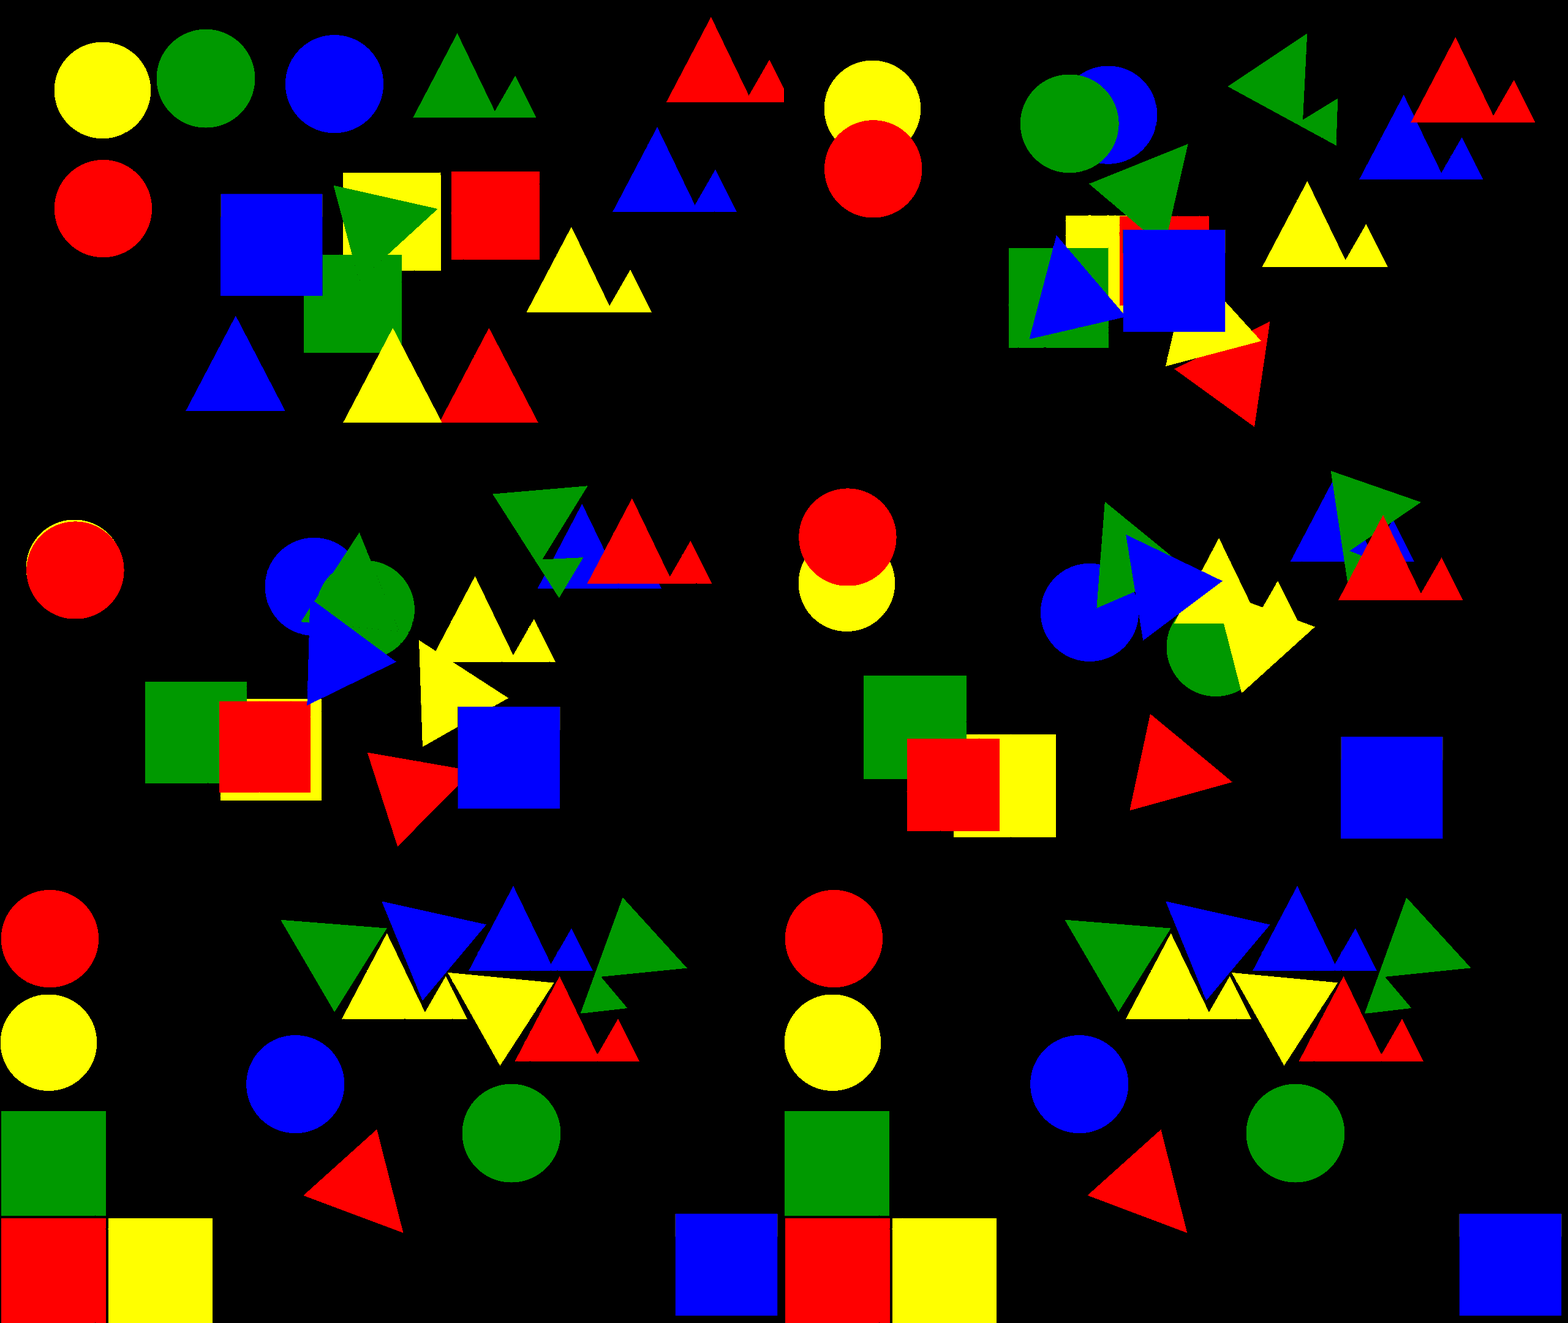
DimpVis
Attribution of causality
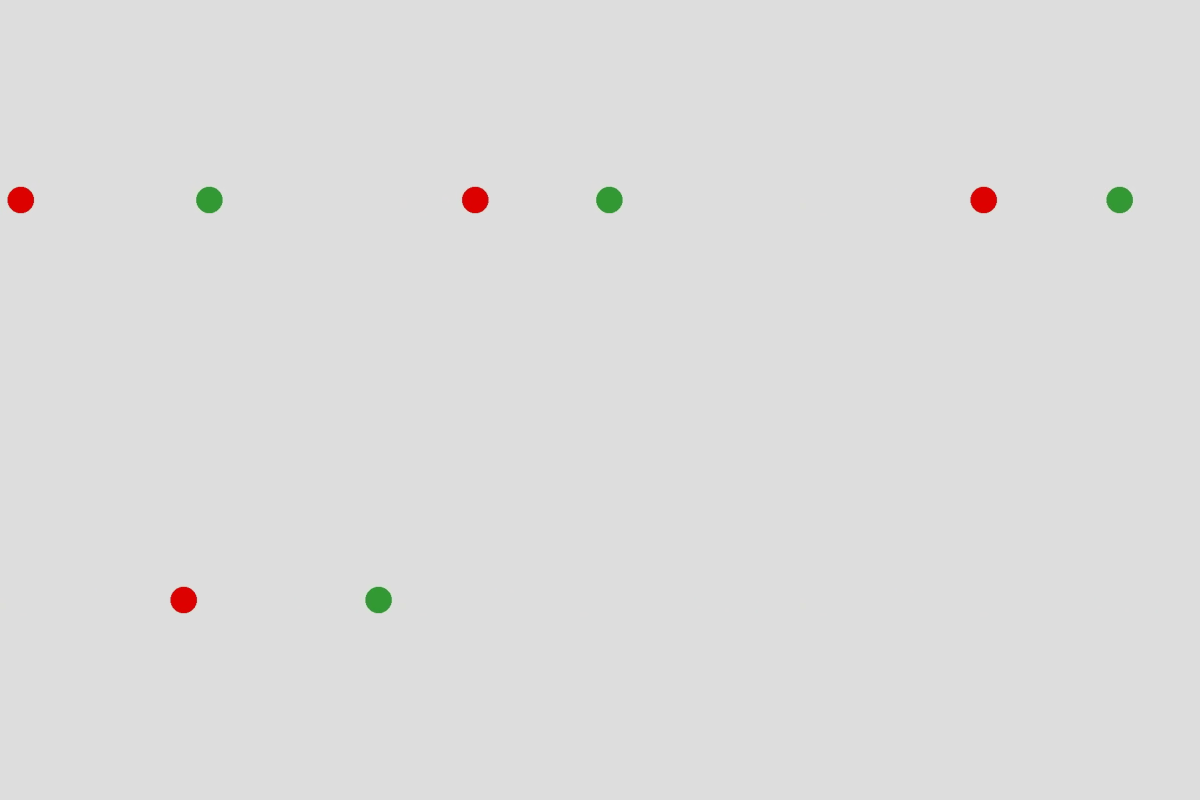
Michotte demonstration 1.
What do you see?
Most observers report that "the red ball hit the green ball." The green ball moved "because the red ball hit it." Thus, the red ball is perceived to "cause"' the green ball to move, even though the balls are nothing more than color disks on your screen that move according to a programme.

How does it work?
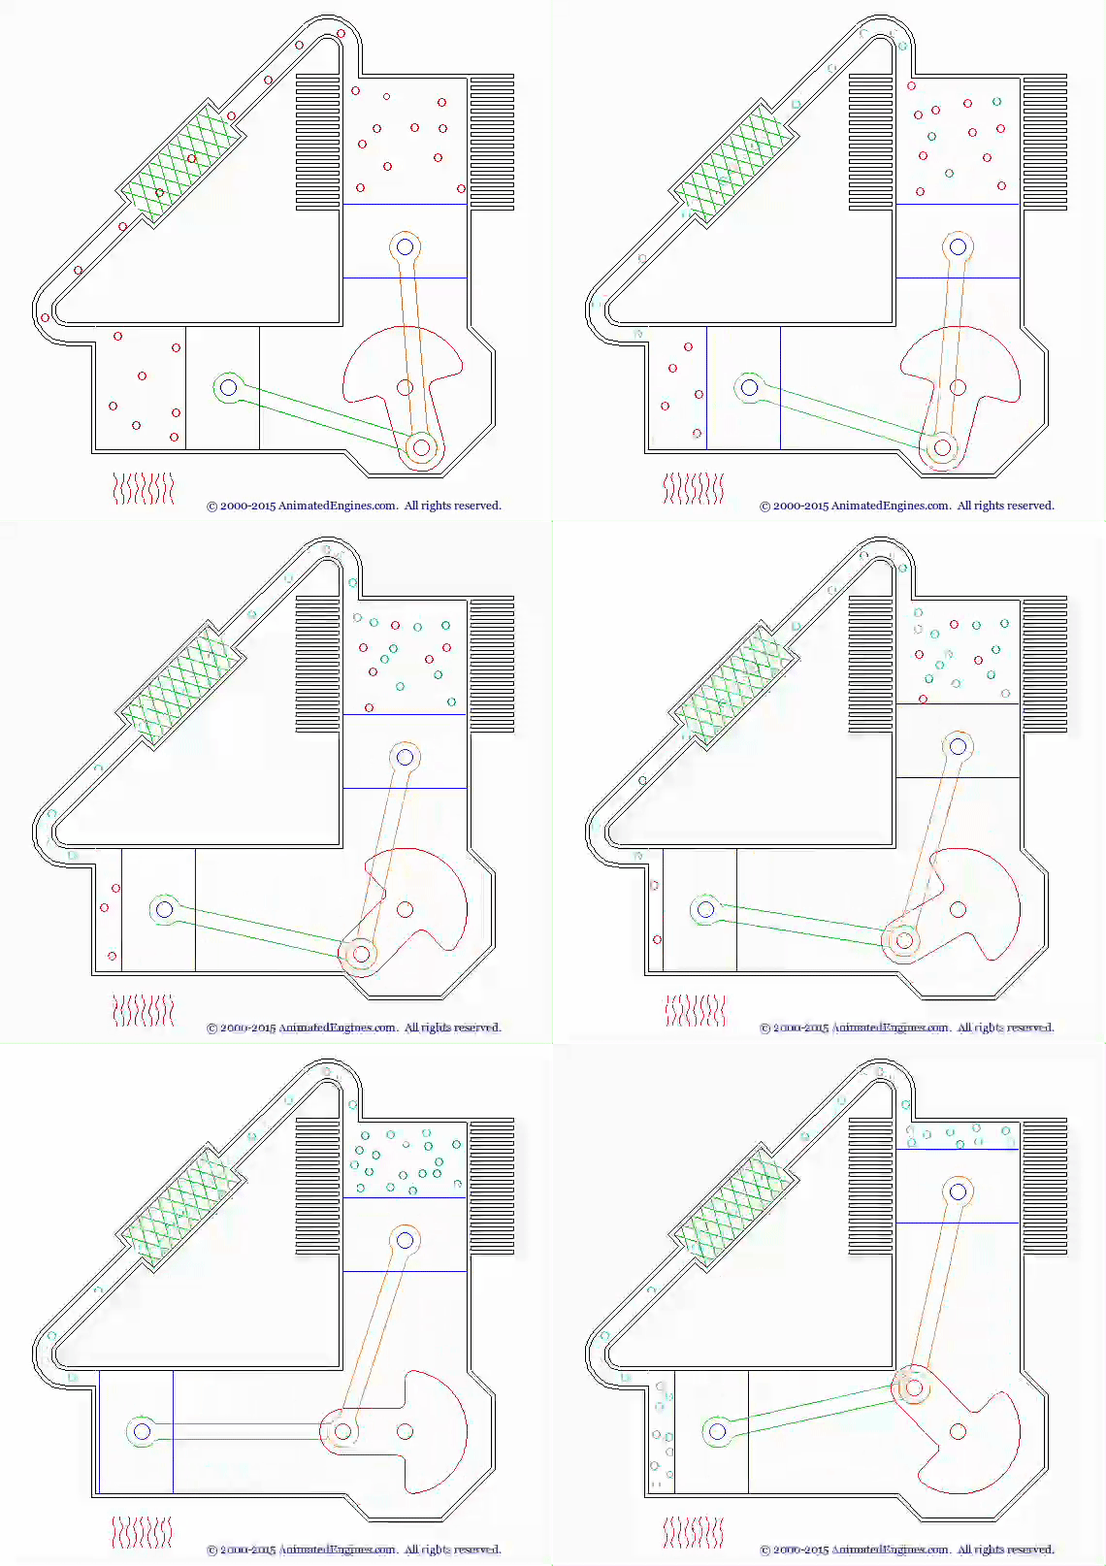
Difficulties in understanding animation
- Difficult to estimate paths and trajectories
- Motion is fleeting and transient
- Cannot simultaneously attend to multiple motions
- Trying to parse motion into events, actions and behaviors
- Misunderstanding and wrongly inferring causality
- Anthropomorphizing physical motion may cause confusion or lead to incorrect conclusions
Break into static steps

Challenges
Choosing the set of steps
- How to segment process into steps?
- Note: Steps often shown sequentially for clarity, rather than showing everything simultaneously
Tversky suggests
- Coarse level – segment based on objects
- Finer level – segment based on actions
- Static depictions often do not show finer level segmentation
Animated transitions in visualization
- Appropriate animation improves graphical perception
- Use simple staged transitions, but doing one thing at a time not always best
- Axis re-scaling hampers perception
- Avoid if possible (use common scale)
- Maintain landmarks better (delay fade out of gridlines)
- Subjects preferred animated transitions
Implementing animation
Frame-based Animation
Redraw scene at regular interval (e.g., 16ms)
Developer defines the redraw function


Transition-based Animation (Hudson & Stasko ‘93)
Specify property value, duration & easing (tweening)
Typically computed via interpolation
Timing & redraw managed by UI toolkit.

D3 Transitions
Any d3 selection can be used to drive animation.
// Select SVG rectangles and bind them to data values.
var bars = svg.selectAll(“rect.bars”).data(values);
// Animated transition: interpolate to target values using default timing
bars.transition()
.attr(“x”, (d) => xScale(d.foo))
.attr(“y”, (d) => yScale(d.bar))
.style(“fill”, (d) => colorScale(d.baz));
// Animation is implicitly queued to run!

bars.transition()
.duration(500) // animation duration in ms
.delay(0) // onset delay in ms
.ease(d3.easeBounce) // set easing (or “pacing”) style
.attr(“x”, (d) => xScale(d.foo))

bars.transition()
.duration(500) // animation duration in ms
.delay(0) // onset delay in ms
.ease(d3.easeBounce) // set easing (or “pacing”) style
.attr(“x”, (d) => xScale(d.foo))
...
bars.exit().transition() // animate elements leaving display
.style(“opacity”, 0) // fade out to fully transparent
.remove(); // remove from DOM upon completion
Easing Functions
Goals: stylize animation, improve perception. Basic idea is to warp time: as duration goes from start (0%) to end (100%), dynamically adjust the interpolation fraction using an easing function

Summary
Animation is a salient visual phenomenon
Attention, object constancy, causality, timing
For processes, step-by-step static images may be preferable
For transitions, animation has some benefits, but consider task and timing