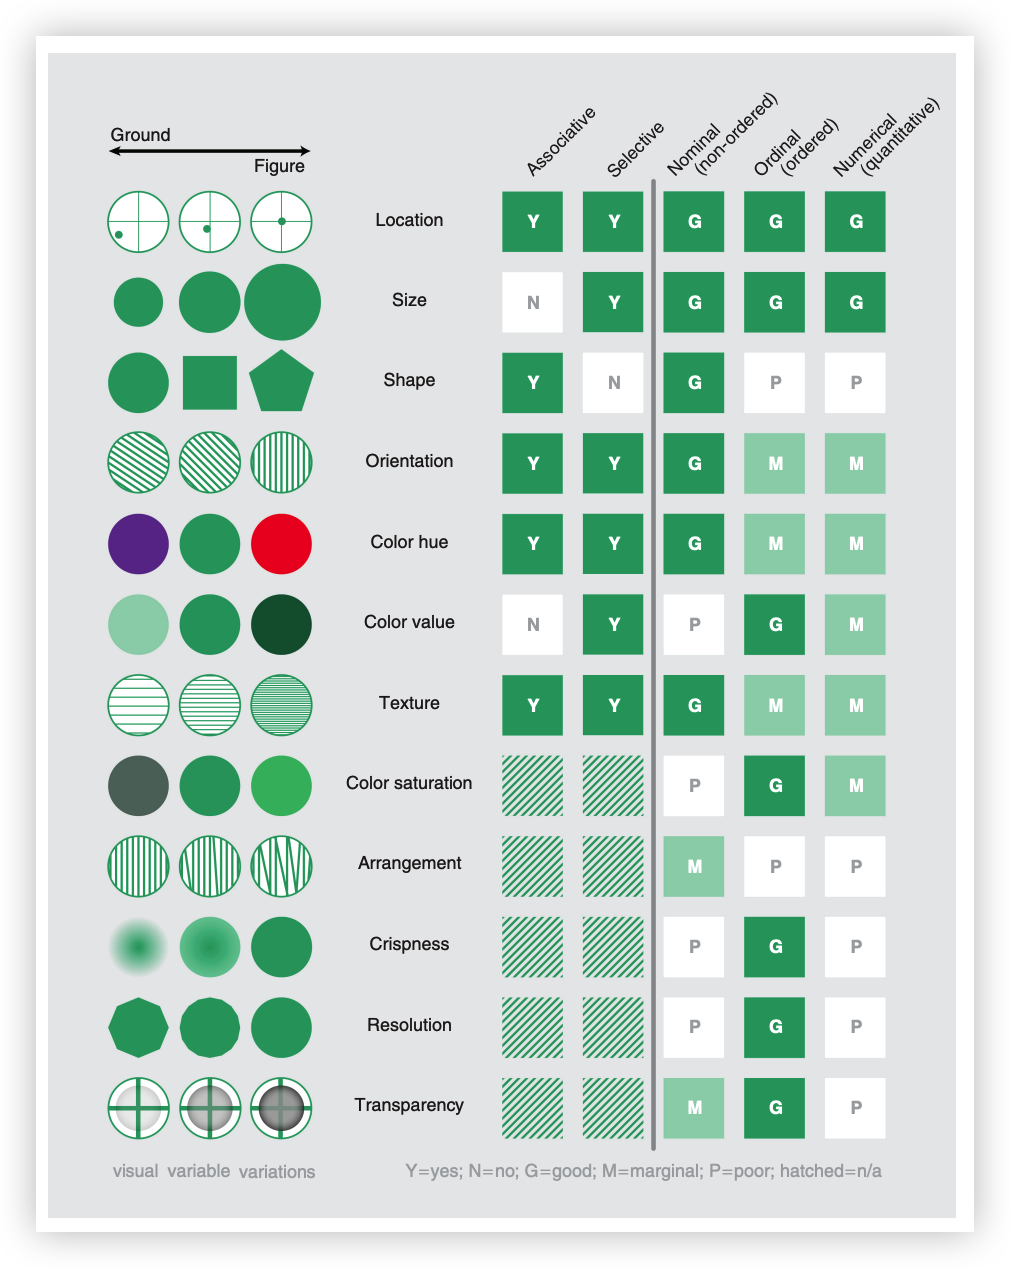
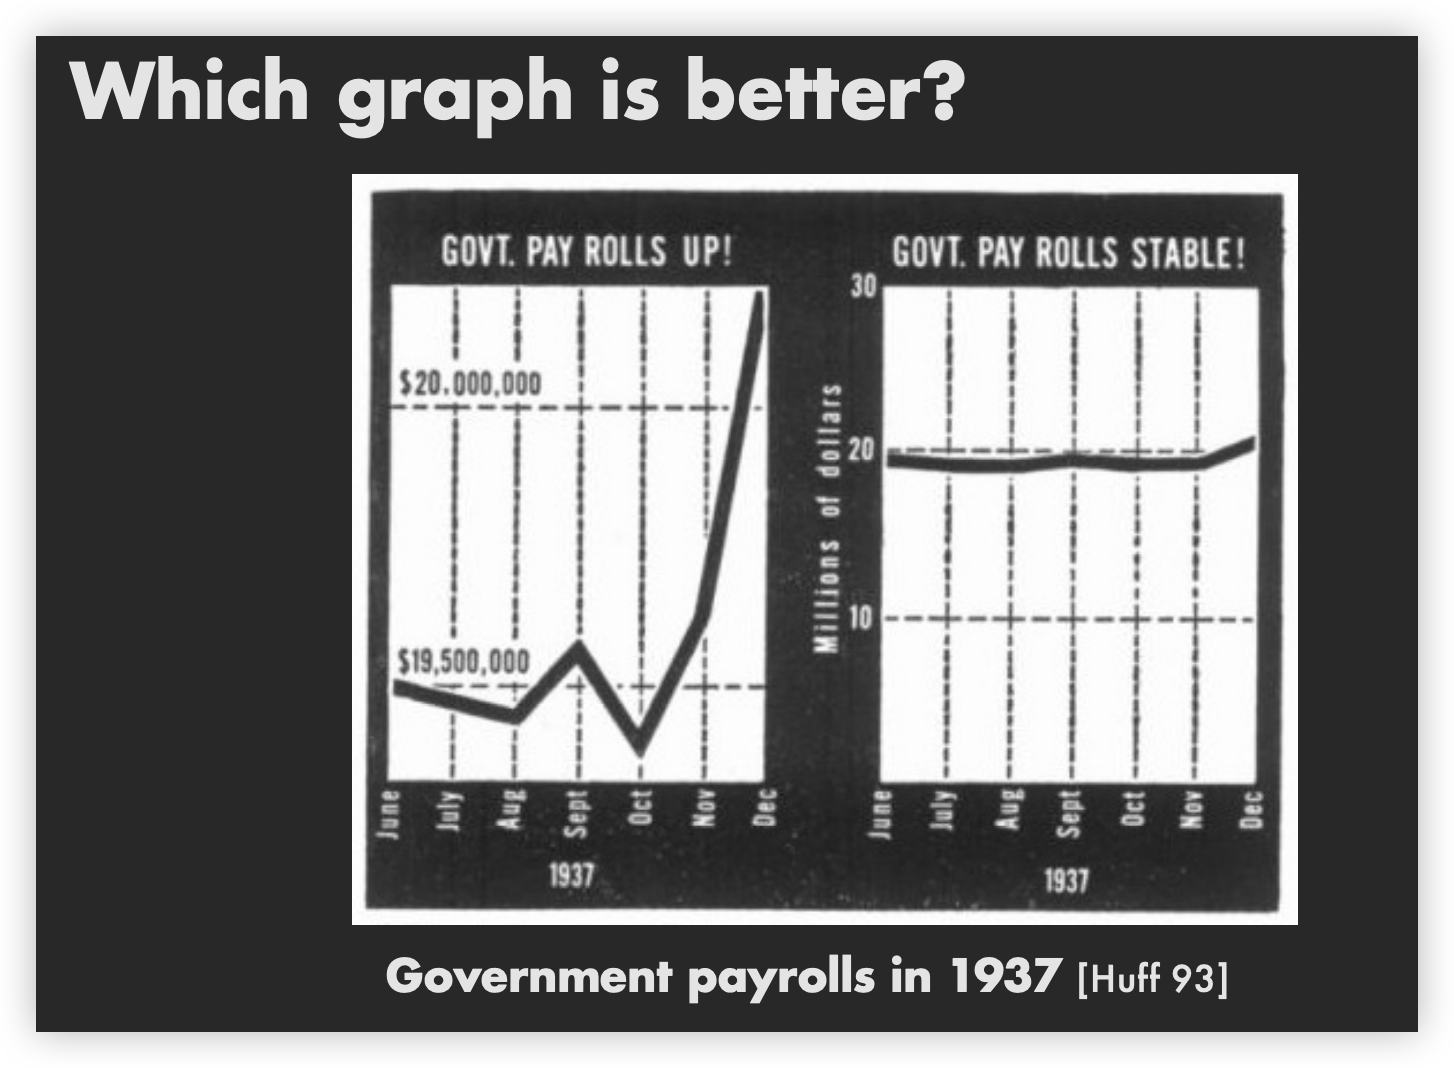
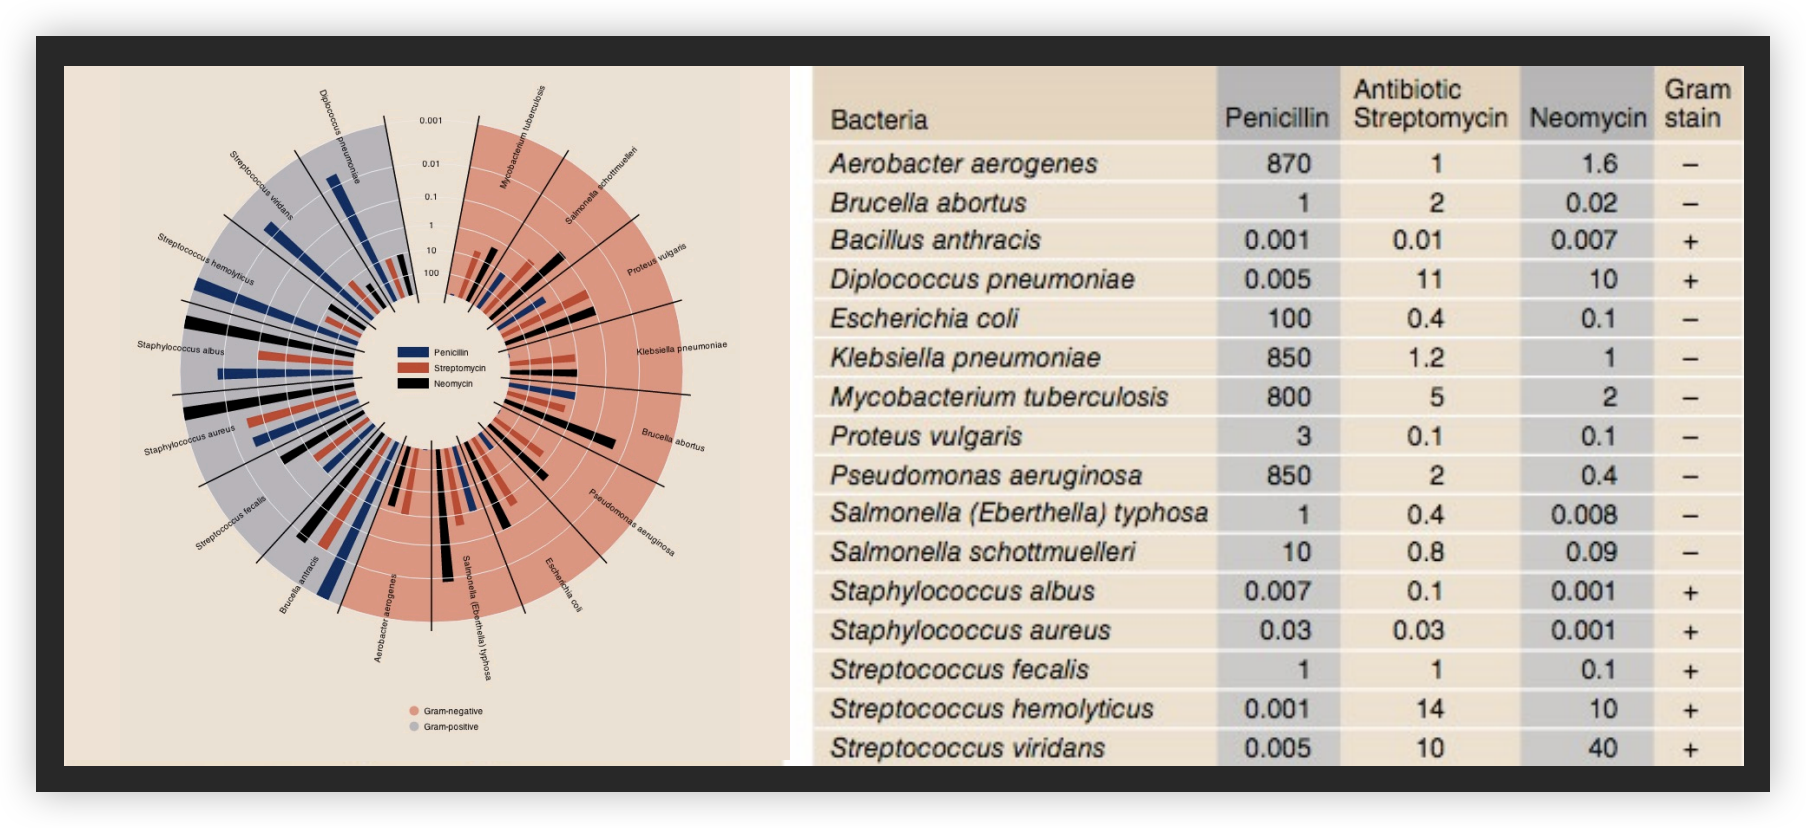
17 posts tagged with "CS448B"

View All Tags

Stanford CS448B 18 TextVis

· 6 min read

TLDR

This article contains my notes from Stanford's CS448B (Data Visualization) course, specifically focusing on the eighteenth lecture about text visualization. I'll discuss the importance of documents, collections of documents, and the different types of visualizations for text data.

Stanford CS448B 17 VisML

· 4 min read

TLDR

This article contains my notes from Stanford's CS448B (Data Visualization) course, specifically focusing on the seventeenth lecture about visualization and machine learning. I'll discuss the importance of understanding data, model training, model evaluation, and the different types of visualizations for machine learning tasks.

Stanford CS448B 16 VisNLP

· 2 min read

TLDR

This article contains my notes from Stanford's CS448B (Data Visualization) course, specifically focusing on the sixteenth lecture about visualization and natural language processing. I'll discuss the importance of linking text with visualization, understanding how readers integrate charts and captions, visual question and answering, and natural language interfaces.

Stanford CS448B 14 Network Analysis

· 4 min read

TLDR

This article contains my notes from Stanford's CS448B (Data Visualization) course, specifically focusing on the fourteenth lecture about network analysis. I'll discuss the importance of centrality, community structure, and simulating network models.

Stanford CS448B 13 Network Layout

· 7 min read

TLDR

This article contains my notes from Stanford's CS448B (Data Visualization) course, specifically focusing on the thirteenth lecture about network layout. I'll discuss the importance of tree layout, node-link graph layout, spanning tree layout, Sugiyama-style graph layout, hierarchical edge bundles, force-directed layout, alternative layouts, attribute-driven layout, and summary.

Stanford CS448B 12 Animation

· 6 min read

TLDR

This article contains my notes from Stanford's CS448B (Data Visualization) course, specifically focusing on the twelfth lecture about animation. I'll discuss the importance of animation in data visualization, the principles behind it, and explore various techniques for visualizing data, including the use of guides, expressiveness, effectiveness, support for comparison and pattern perception, grouping and sorting data, transforming data, reducing cognitive overhead, and consistency. I'll also cover various chart types, such as line charts, bar charts, stacked area charts, and others, providing examples and discussing their design considerations.

Stanford CS448B 11 Color

· 6 min read

TLDR

This article contains my notes from Stanford's CS448B (Data Visualization) course, specifically focusing on the eleventh lecture about color. I'll discuss the importance of color in data visualization, the principles behind it, and explore various techniques for visualizing data, including the use of guides, expressiveness, effectiveness, support for comparison and pattern perception, grouping and sorting data, transforming data, reducing cognitive overhead, and consistency. I'll also cover various chart types, such as line charts, bar charts, stacked area charts, and others, providing examples and discussing their design considerations.

Stanford CS448B 10 VisExplainers

· 4 min read

TLDR

This article contains my notes from Stanford's CS448B (Data Visualization) course, specifically focusing on the tenth lecture about visualization explainers. I'll discuss the importance of storytelling, design space of narrative visualization, interactive documents, chart sequences, and GraphScape.

Stanford CS448B 09 Perception

· 5 min read

TLDR

This article contains my notes from Stanford's CS448B (Data Visualization) course, specifically focusing on the ninth lecture about perception. I'll discuss the importance of perception in data visualization, the principles behind it, and explore various techniques for visualizing data, including the use of guides, expressiveness, effectiveness, support for comparison and pattern perception, grouping and sorting data, transforming data, reducing cognitive overhead, and consistency. I'll also cover various chart types, such as line charts, bar charts, stacked area charts, and others, providing examples and discussing their design considerations.

Stanford CS448B 07 IntroD3

· 2 min read

TLDR

This article contains my notes from Stanford's CS448B (Data Visualization) course, specifically focusing on the seventh lecture about introduction to D3. I'll discuss the importance of D3, the principles behind it, and explore various techniques for visualizing data, including the use of guides, expressiveness, effectiveness, support for comparison and pattern perception, grouping and sorting data, transforming data, reducing cognitive overhead, and consistency. I'll also cover various chart types, such as line charts, bar charts, stacked area charts, and others, providing examples and discussing their design considerations.

Stanford CS448B 06 Interaction

· 3 min read

TLDR

This article contains my notes from Stanford's CS448B (Data Visualization) course, specifically focusing on the sixth lecture about interaction. I'll discuss the importance of interaction in data visualization, the principles behind it, and explore various techniques for visualizing data, including the use of guides, expressiveness, effectiveness, support for comparison and pattern perception, grouping and sorting data, transforming data, reducing cognitive overhead, and consistency. I'll also cover various chart types, such as line charts, bar charts, stacked area charts, and others, providing examples and discussing their design considerations.

Stanford CS448B 05 Space2D

· 6 min read

TLDR

This article contains my notes from Stanford's CS448B (Data Visualization) course, specifically focusing on the fifth lecture about space in 2D. I'll discuss the importance of space in data visualization, the principles behind it, and explore various techniques for visualizing data, including the use of guides, expressiveness, effectiveness, support for comparison and pattern perception, grouping and sorting data, transforming data, reducing cognitive overhead, and consistency. I'll also cover various chart types, such as line charts, bar charts, stacked area charts, and others, providing examples and discussing their design considerations.

Stanford CS448B 04 Eda

· 4 min read

TLDR

This article contains my notes from Stanford's CS448B (Data Visualization) course, specifically focusing on the fourth lecture about exploratory data analysis. I'll discuss the importance of exploratory data analysis, the principles behind it, and explore various techniques for visualizing data, including the use of guides, expressiveness, effectiveness, support for comparison and pattern perception, grouping and sorting data, transforming data, reducing cognitive overhead, and consistency. I'll also cover various chart types, such as line charts, bar charts, stacked area charts, and others, providing examples and discussing their design considerations.

Stanford CS448B 03 Visdesigns

· 2 min read

TLDR

This article contains my notes from Stanford's CS448B (Data Visualization) course, specifically focusing on the third lecture about visualization designs. I'll discuss the principles of effective data visualization, including the importance of guides, expressiveness, effectiveness, support for comparison and pattern perception, grouping and sorting data, transforming data, reducing cognitive overhead, and consistency. I'll also cover various chart types, such as line charts, bar charts, stacked area charts, and others, providing examples and discussing their design considerations.

Stanford CS448B 02 Data

· 3 min read

TLDR

This article contains my notes from Stanford's CS448B (Data Visualization) course, specifically focusing on the second lecture about data. I'll discuss the different types of data models and how they can be categorized, as well as the distinction between dimensions and measures. I'll also cover data tables and transformations.

Stanford CS448B 01 Purpose

· 2 min read

TLDR

This article contains my notes from Stanford's CS448B (Data Visualization) course, specifically focusing on the first lecture about the purpose of data visualization. I'll share several historical examples that demonstrate the power and importance of visualization in understanding data, including famous cases like Anscombe's quartet, John Snow's cholera map, and Minard's visualization of Napoleon's Russian campaign. These examples illustrate how visualization can reveal patterns, solve mysteries, and communicate complex information effectively.