Stanford CS448B 02 Data
TLDR
This article contains my notes from Stanford's CS448B (Data Visualization) course, specifically focusing on the second lecture about data. I'll discuss the different types of data models and how they can be categorized, as well as the distinction between dimensions and measures. I'll also cover data tables and transformations.

Original
Notes
Total
The Process of Data Visualization
Data models vs. Conceptual models
- Data models are formal descriptions
- Conceptual models are mental constructions
1D floats vs. temperature
3D vector of floats vs. spatial location
Data models facilitate easier calculations, while conceptual models serve as a medium for understanding.
Taxonomy of Data Models/Types
- 1D (sets and sequences)
- Temporal
- 2D (maps)
- 3D (shapes)
- nD (relational)
- Trees (hierarchies)
- Networks (graphs)
* Nominal, Ordinal and Quantitative *

-
Data model
- 32.5, 54.0, -17.3, …
- Floating point numbers
-
Conceptual model
- Temperature (℃)
-
N,O,Q
- Burned vs. Not burned (N)
- Hot, warm, cold (O)
- Continuous range of values (Q-Int)
The N,O,Q model is the most commonly used method for determining visual channels.
And the visual channel will determine the type of diagram.
Dimensions and Measures
Dimensions: (~independent variables)
- Often discrete variables describing data (N, O)
- Categories, dates, binned values
Measures: (~dependent variables)
- Data values that can be aggregated (Q)
- Numbers to be analyzed
- Aggregate as sum, count, average, std. deviation
Distinction is not strict. The same variable may be treated either way depending on the task.
-
U.S. Census Data
- People Count: # of people in group
- Year: 1850 – 2000 (every decade)
- Age: 0 – 90+
- Sex: Male, Female
- Marital Status: Single, Married, Divorced, …
-
Census: N, O, Q?
- People Count:Q-Ratio
- Year:Q-Interval (O)
- Age:Q-Ratio (O)
- Sex:N
- Marital Status:N
-
Census: Dim. or Meas.?
- People Count:Measure
- Year:Dimension
- Age:Depends!
- Sex:Dimension
- Marital Status:Dimension
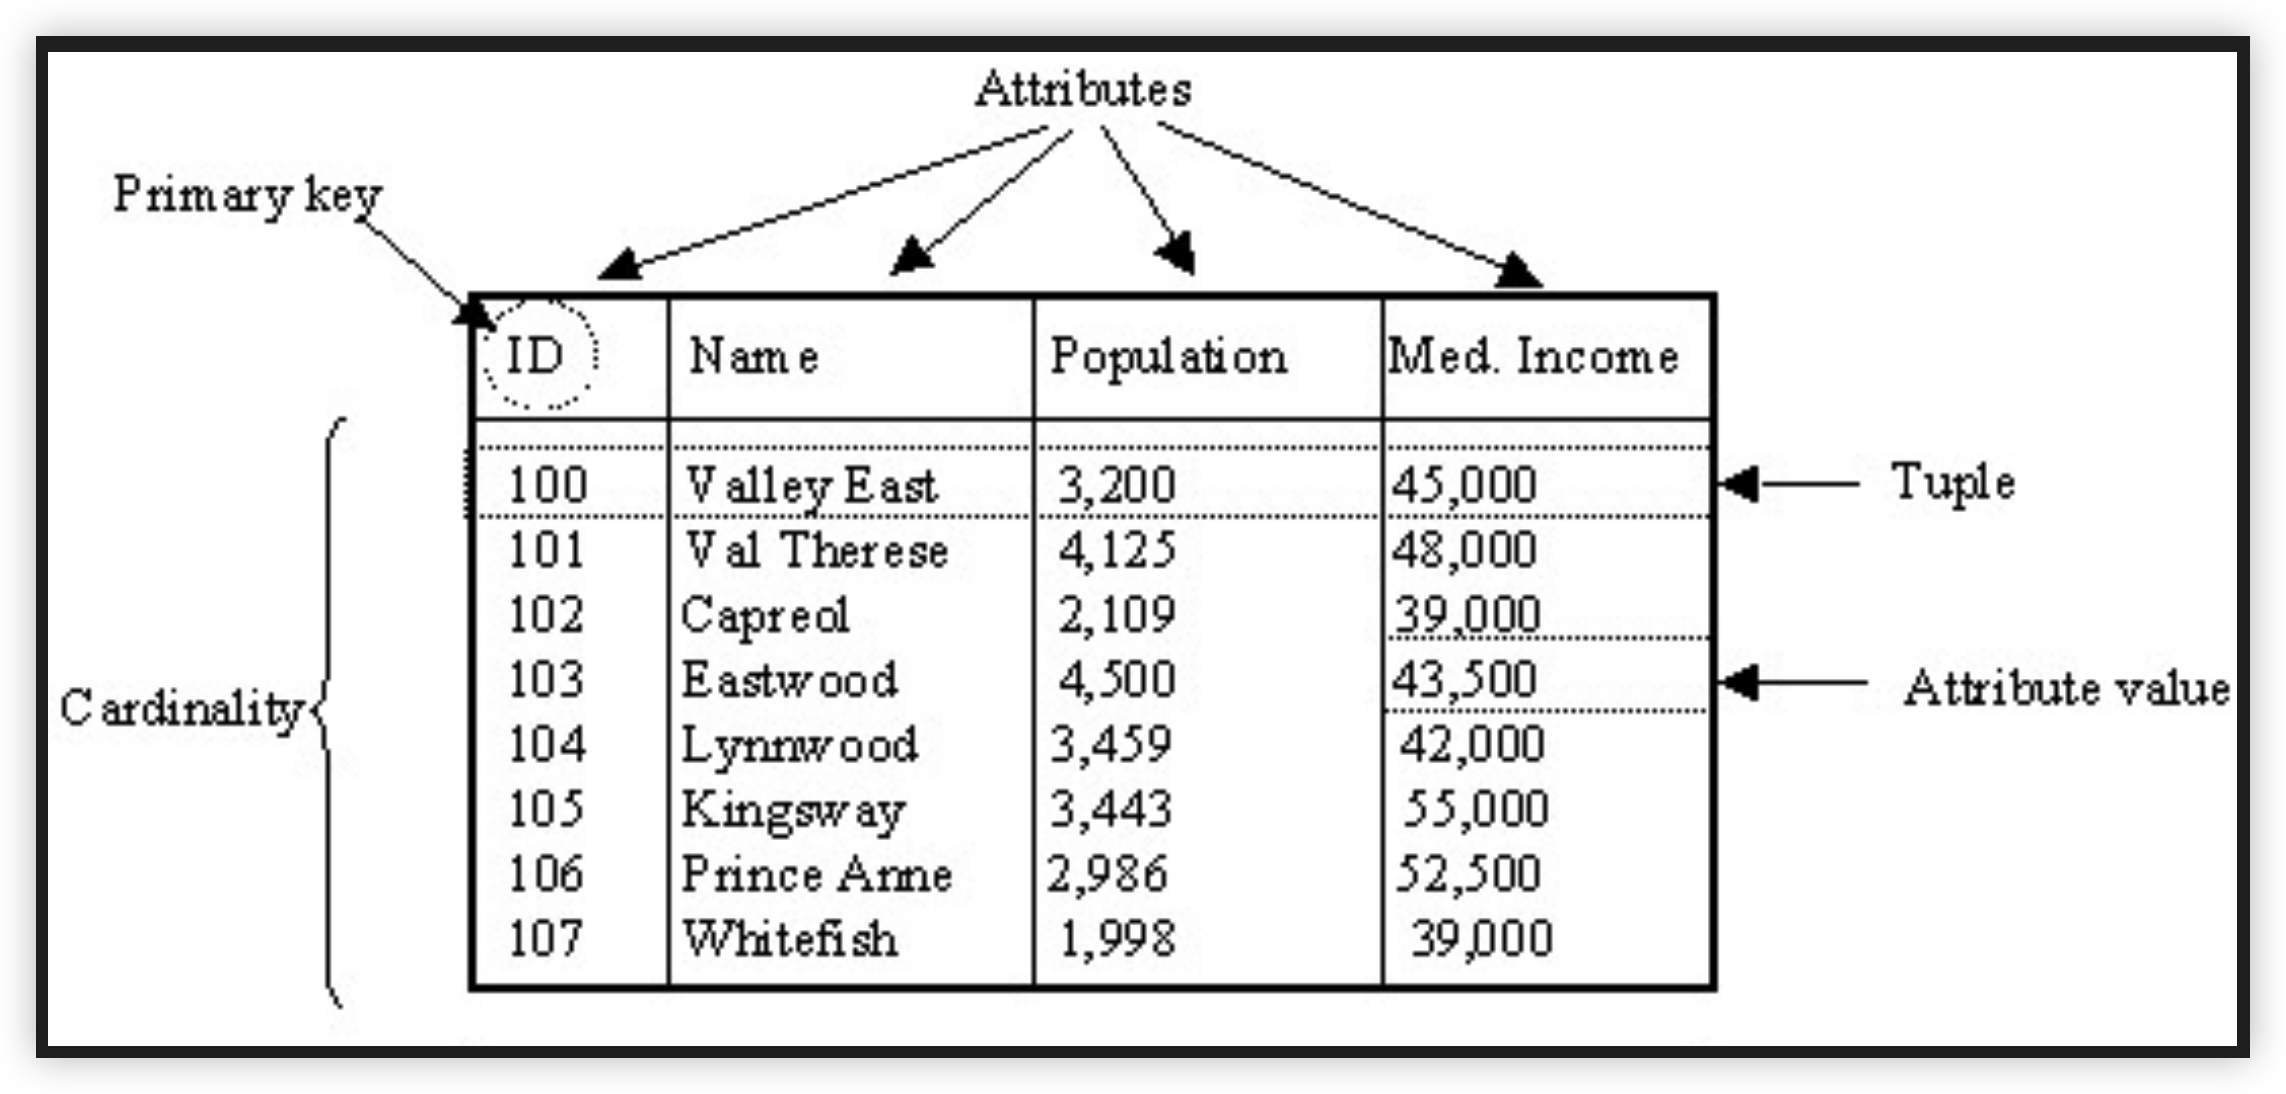
Data Tables and Transformations
- Represent data as a table (relation)
- Each row (tuple) represents a single record
- Each record is a fixed-length tuple
- Each column (attribute) represents a single variable
- Each attribute has a name and a data type
- A table’s schema is the set of attribute names and data types
- A database is a collection of tables (relations)
All values within the same category should remain in the same dimensionality.
For example, if the task is to statistic the sex of individuals, but some people are not yet born, we should add a new category/column to indicate whether they are born, instead of adding a new value "Not born" in the sex category/column.
SQL Content
Not my focus, so I skipped it.