Extending ECharts Global Roaming
TLDR
This article explores how to extend ECharts' global roaming functionality. While ECharts provides roaming through dataZoom for Cartesian charts, relationship-type charts lack full global roaming support. We'll examine ECharts' current single-series roaming implementation and develop a solution to enable global roaming across all chart types.

Task
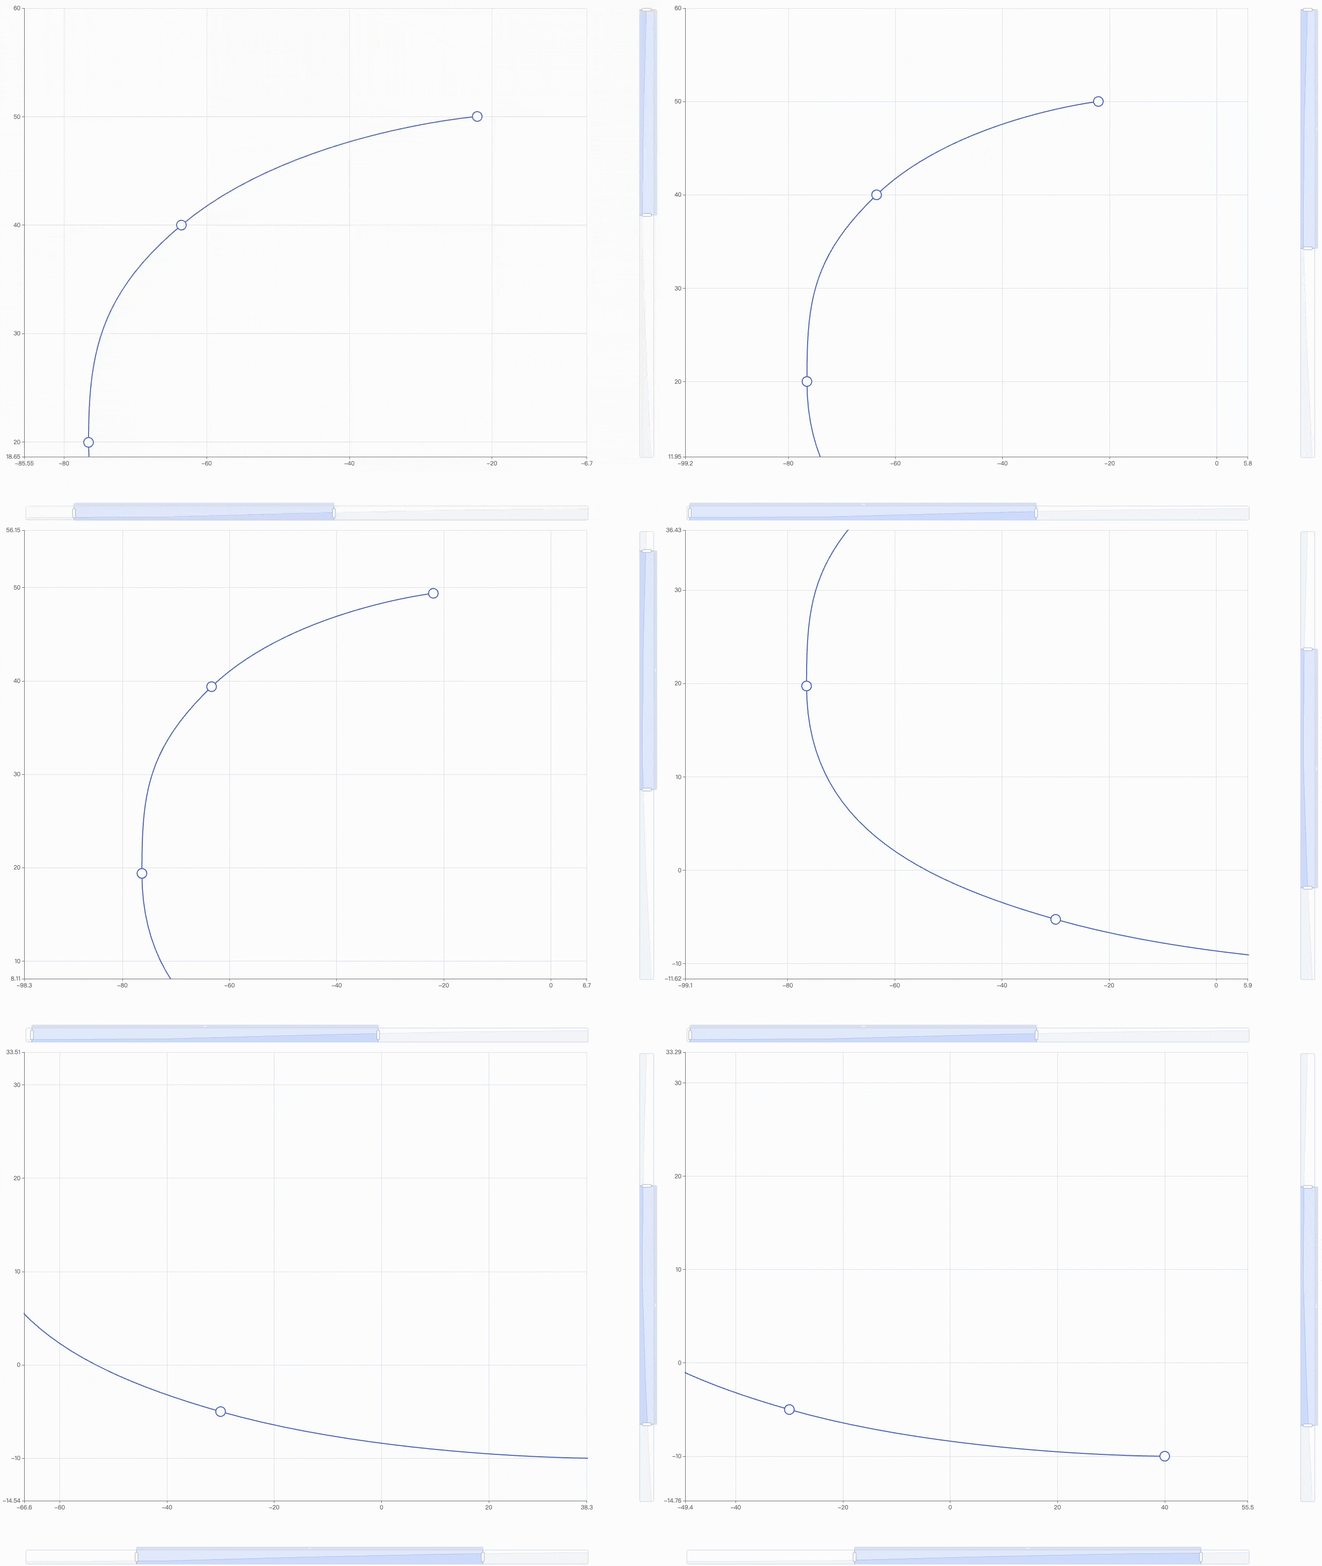
Despite ECharts offering hundreds of visualization features through its extensive configuration options, some common functionalities, such as the roaming feature, remain unmet. In ECharts, zooming and moving charts (collectively referred to as roaming hereafter) can be achieved in two ways. For charts using Cartesian coordinates (like line and bar charts), ECharts enables the roaming feature through the dataZoom component.

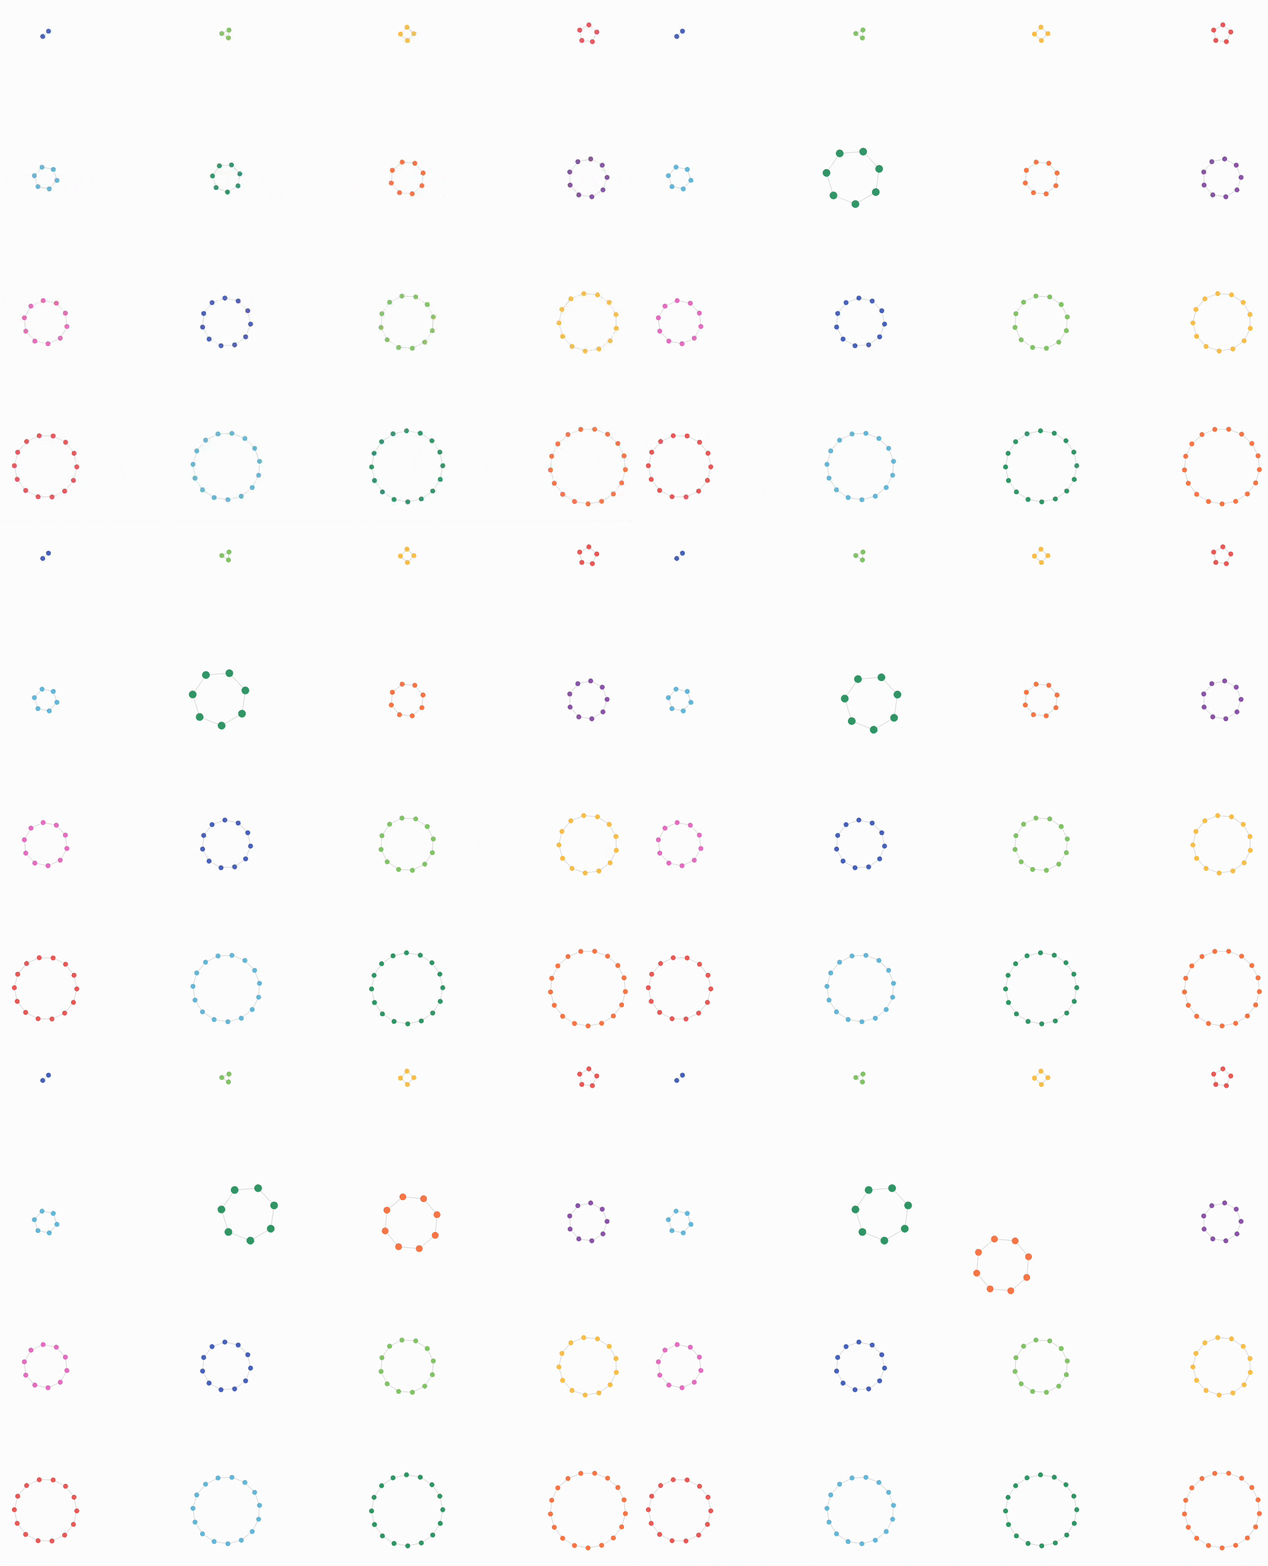
However, for relationship-type charts (such as Sankey and Sunburst charts—relation charts without lines), global roaming is not fully supported. Currently, only single-series roaming is implemented within the most common types of relationship charts(Graph).

Original Roaming Solution
Let's take a brief look at how ECharts implements single-series roaming support in relationship charts.
Here we assume that you have already read article ECharts Overview and have some understanding of the basic structure of ECharts.
Charts divides each chart into two main files: model and view. The view file is responsible for rendering the visual display, updating, and event binding.In each view file, there is an init function for collecting and initializing various variables, and a core render function for executing the main drawing operations and basic event binding.
// chart/graph/GraphView.ts

init(ecModel: GlobalModel, api: ExtensionAPI) {
    const symbolDraw = new SymbolDraw();
    const lineDraw = new LineDraw();
    const group = this.group;

    this._controller = new RoamController(api.getZr());
    this._controllerHost = {
        target: group
    } as RoamControllerHost;

    group.add(symbolDraw.group);
    group.add(lineDraw.group);

    this._symbolDraw = symbolDraw;
    this._lineDraw = lineDraw;

    this._firstRender = true;
}

render(seriesModel: GraphSeriesModel, ecModel: GlobalModel, api: ExtensionAPI) {

    // some render code
    this._updateController(seriesModel, ecModel, api);
    // ...
}

_updateController(
    seriesModel: GraphSeriesModel,
    ecModel: GlobalModel,
    api: ExtensionAPI
) {
    const controller = this._controller;
    const controllerHost = this._controllerHost;
    const group = this.group;

    controller.setPointerChecker(function (e, x, y) {
        const rect = group.getBoundingRect();
        rect.applyTransform(group.transform);
        return rect.contain(x, y)
            && !onIrrelevantElement(e, api, seriesModel);
    });

    if (!isViewCoordSys(seriesModel.coordinateSystem)) {
        controller.disable();
        return;
    }
    controller.enable(seriesModel.get('roam'));
    controllerHost.zoomLimit = seriesModel.get('scaleLimit');
    controllerHost.zoom = seriesModel.coordinateSystem.getZoom();

    controller
        .off('pan')
        .off('zoom')
        .on('pan', (e) => {
            roamHelper.updateViewOnPan(controllerHost, e.dx, e.dy);
            api.dispatchAction({
                seriesId: seriesModel.id,
                type: 'graphRoam',
                dx: e.dx,
                dy: e.dy
            });
        })
        .on('zoom', (e) => {
            roamHelper.updateViewOnZoom(controllerHost, e.scale, e.originX, e.originY);
            api.dispatchAction({
                seriesId: seriesModel.id,
                type: 'graphRoam',
                zoom: e.scale,
                originX: e.originX,
                originY: e.originY
            });
            this._updateNodeAndLinkScale();
            adjustEdge(seriesModel.getGraph(), getNodeGlobalScale(seriesModel));
            this._lineDraw.updateLayout();
            // Only update label layout on zoom
            api.updateLabelLayout();
        });
}
In the graph series, the panning and zooming functionality is mainly divided into Pan and Zoom events, both of which are implemented by the roamHelper.
// component/helper/RoamHelper.ts
import Element from 'zrender/src/Element';

interface ControllerHost {
  target: Element;
  zoom?: number;
  zoomLimit?: { min?: number; max?: number };
}

/**
 * For geo and graph.
 */
export function updateViewOnPan(
  controllerHost: ControllerHost,
  dx: number,
  dy: number
) {
  const target = controllerHost.target;
  target.x += dx;
  target.y += dy;
  target.dirty();
}

/**
 * For geo and graph.
 */
export function updateViewOnZoom(
  controllerHost: ControllerHost,
  zoomDelta: number,
  zoomX: number,
  zoomY: number
) {
  const target = controllerHost.target;
  const zoomLimit = controllerHost.zoomLimit;

  let newZoom = (controllerHost.zoom = controllerHost.zoom || 1);
  newZoom *= zoomDelta;
  if (zoomLimit) {
    const zoomMin = zoomLimit.min || 0;
    const zoomMax = zoomLimit.max || Infinity;
    newZoom = Math.max(Math.min(zoomMax, newZoom), zoomMin);
  }
  const zoomScale = newZoom / controllerHost.zoom;
  controllerHost.zoom = newZoom;
  // Keep the mouse center when scaling
  target.x -= (zoomX - target.x) * (zoomScale - 1);
  target.y -= (zoomY - target.y) * (zoomScale - 1);
  target.scaleX *= zoomScale;
  target.scaleY *= zoomScale;

  target.dirty();
}
The logic of roamHelper is very simple. It updates the world coordinate matrix of the collected graphical elements in ControllerHost based on the variables received from the mouse events. The object that binds the mouse events and the object that updates the world coordinates are consistent, which is as expected.
If we want to implement global roaming functionality, we first need to replace the target graphical elements in the ControllerHost with global graphical elements, which is typically a group object that contains all the graphics. Then, we need to listen for mouse events across the entire canvas and update the world coordinate matrix of the global group. The rendering engine within ECharts named Zrender, will automatically apply the changes in the parent element's coordinate matrix to the child elements.
Extending ECharts
ECharts provides many extension interfaces. For global roaming, we define it as a component, which can be registered using the use API provided by ECharts.
Global Roaming Model
In the Model, the primary focus is on data-related operations, which generally include defining the configuration options exposed externally and processing data needed for subsequent rendering. The main logic for Global Roaming resides in the View files, so the configuration options are primarily defined here.
// component/roam/RoamModel.ts

export interface RoamOption extends ComponentOption, RoamOptionMixin {
  mainType?: 'roam';

  /**
   * Roam is designed for view rather than cartesian2d coordinates
   * Additional processing needed to make roam work with cartesian2d
   * while keeping consistent behavior across coordinate systems
   */
  adaptAxis?: boolean;

  /**
   * Zoom behavior varies significantly across devices
   * This ratio parameter helps normalize zoom sensitivity
   */
  zoomRatio?: number;

  panRatio?: number;
  /** Pan direction, defaults to 'xy' for bidirectional panning
   *
   * - 'xy': Pan in both directions simultaneously
   * - 'x': Pan only horizontally
   * - 'y': Pan only vertically
   * - 'x|y': Allow either horizontal or vertical panning, auto-detected
   */
  panDirection: 'x|y' | 'x' | 'y' | 'xy';

  // Whether to restrict roaming within canvas bounds, default true
  roamLimit?: boolean;

  // Disable horizontal panning, default false
  banPanX?: boolean;

  // Disable vertical panning, default false
  banPanY?: boolean;

  // Disable zooming, default false
  banZoom?: boolean;
}

class RoamModel<
  Opts extends RoamOption = RoamOption
> extends ComponentModel<Opts> {
  [x: string]: any;

  static type = 'roam';

  type = RoamModel.type;

  static defaultOption: RoamOption = {
    roam: true,
    zoom: 1,
    center: ['50%', '50%'],
    adaptAxis: false,
    panRatio: 1,
    panDirection: 'xy',
    zoomRatio: 1,
    roamLimit: true,
    banPanX: false,
    banPanY: false,
    banZoom: false,
  };
}

export default RoamModel;
Global Roaming View
// component/roam/RoamView.ts

init(ecModel: GlobalModel, api: ExtensionAPI) {
    this.ecModel = ecModel;
    this.api = api;
    this.__controller = new RoamController(api.getZr());
    this.__seriesControllerHosts = [];
}

render(roamModel: RoamModel, ecModel: GlobalModel, api: ExtensionAPI, payload: Payload): void {
  this.roamModel = roamModel;
  this.__initCenterAndZoom(payload);

  if (!this.__initRendered) {
    this.__initRendered = true;

    /**
     * Initialize event objects
     * Must be placed in render because group cannot be obtained in init
     */
    this.__seriesGroupArr = this.__getSeriesGroupArr();
    this.__axesGroupArr = this.__getAxesGroupArr();
    this.__seriesControllerHosts = this.__seriesGroupArr.map(
      d =>
        ({
          target: d,
          // Currently X and Y do not support independent scaling, so X scaling is treated as global scaling factor
          zoom: d.transform ? d.transform[0] : 1,
          zoomLimit: roamModel.get('scaleLimit')!
        } as unknown as ControllerHost)
    );
    this.__axesControllerHosts = this.__axesGroupArr.map(
      d =>
        ({
          target: d,
          zoom: d.transform ? d.transform[0] : 1,
          zoomLimit: roamModel.get('scaleLimit')!,
          axes: (d as any).__ecComponentInfo?.mainType
        } as unknown as ControllerHost)
    ) as AxesControllerHost[];
  }

  /**
   * Bind roam events
   */
  this.__controllerHandler(roamModel);
}


private __getSeriesGroupArr() {
    const zrIns = this.api.getZr();
    const { storage } = zrIns;
    const seriesGroupArr: graphic.Group[] = [];
    storage.getRoots().forEach(root => {
      const mainType = (root as any).__ecComponentInfo?.mainType ?? null;
      if (RoamView.seriesType.includes(mainType)) {
        seriesGroupArr.push(root as graphic.Group);
      }
    });
    return seriesGroupArr;
}

private __getAxesGroupArr() {
    const zrIns = this.api.getZr();
    const { storage } = zrIns;
    const axesGroupArr: graphic.Group[] = [];
    storage.getRoots().forEach(root => {
      const mainType = (root as any).__ecComponentInfo?.mainType ?? null;
      if (RoamView.axesType.includes(mainType)) {
        axesGroupArr.push(root as graphic.Group);
      }
    });
    return axesGroupArr;
}
Note that, unlike in the ECharts source code, we do not collect graphical elements in the init function here. This is because there is typically a mesh-like dependency relationship between components and charts. ECharts internally uses weights to ensure that components or charts that are relied upon do not execute later in the lifecycle, which would cause rendering exceptions for dependent components or charts. Since this involves deeper-level source code, we rely on the lifecycle to ensure that Roam runs last, rather than using the native weight setting. This ensures that roam is always able to collect all initialized graphical elements on the canvas.
Indeed, this solution isn't perfect, but it can address 80% of the issues with only 20% of the development effort.
For the core part of updating world coordinates, we have extracted it into a general helper and divided it into different helpers based on various scenarios. During the final application of updates, each category applies its corresponding helper to update the coordinates.
The overall logic for coordinate updates remains unchanged, with only some configuration options added and special handling for certain components.
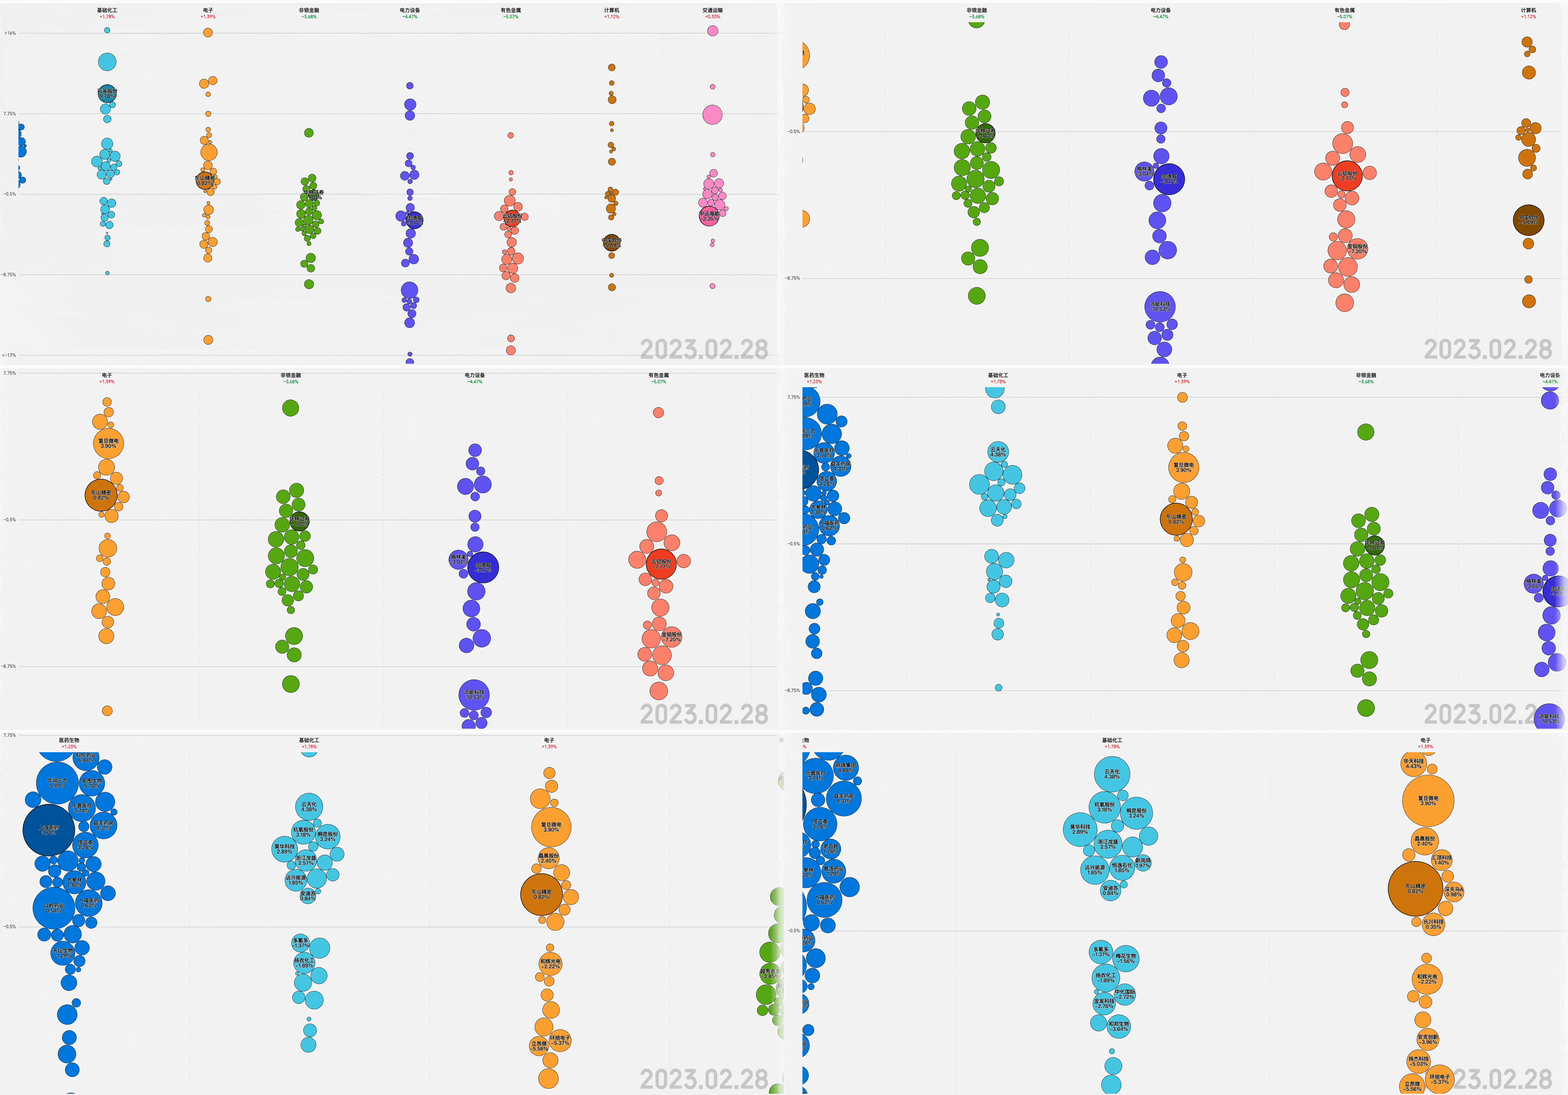
For example, in a beeswarm plot, we achieve the interaction between relational graphs and the Cartesian coordinate system through layout, and implement the zooming of the Cartesian coordinate system using different categories of helpers. This allows for unified roaming through the roam component without the need to additionally adapt the DataZoom component.
// component/roam/roamHelper.ts
export function doUpdateSeriesViewOnPanAndZoom(
  controllerHost: ControllerHost,
  {
    dx = 0,
    dy = 0,
    zoomDelta = 1,
    zoomX = 0,
    zoomY = 0,
    dirty = true,
  }: {
    dx?: number;
    dy?: number;
    zoomDelta?: number;
    zoomX?: number;
    zoomY?: number;
    dirty?: boolean;
  },
  animation?: boolean | ElementAnimateConfig
) {
  const { target, zoomLimit } = controllerHost;

  // pan
  let x = target.x + dx;
  let y = target.y + dy;

  // zoom
  let { scaleX } = target;
  let { scaleY } = target;
  const originControllerHostZoom = controllerHost.zoom;
  if (typeof zoomDelta === 'number') {
    controllerHost.zoom = controllerHost.zoom || 1;
    let newZoom = controllerHost.zoom;
    newZoom *= zoomDelta;

    if (zoomLimit) {
      const zoomMin = zoomLimit.min || 0;
      const zoomMax = zoomLimit.max || Infinity;
      newZoom = Math.max(Math.min(zoomMax, newZoom), zoomMin);
    }
    const zoomScale = newZoom / controllerHost.zoom;
    controllerHost.zoom = newZoom;

    target.stopAnimation();

    // Keep the mouse center when scaling
    x -= (zoomX - target.x) * (zoomScale - 1);
    y -= (zoomY - target.y) * (zoomScale - 1);
    scaleX *= zoomScale;
    scaleY *= zoomScale;
  }

  const originX = target.x;
  const originY = target.y;
  const originScaleX = target.scaleX;
  const originScaleY = target.scaleY;

  if (!animation) {
    target.x = x;
    target.y = y;
    target.scaleX = scaleX;
    target.scaleY = scaleY;

    if (dirty) {
      target.dirty();
    }
  } else {
    target.animateTo(
      { x, y, scaleX, scaleY },
      animation === true ? {} : animation
    );
  }

  return () => {
    target.x = originX;
    target.y = originY;
    target.scaleX = originScaleX;
    target.scaleY = originScaleY;
    controllerHost.zoom = originControllerHostZoom;
  };
}
// component/roam/asexRoamHelper.ts
export function doUpdateAxesViewOnPanAndZoom(
  controllerHost: AxesControllerHost,
  {
    dx = 0,
    dy = 0,
    zoomDelta = 1,
    zoomX = 0,
    zoomY = 0,
    dirty = true,
  }: {
    dx?: number;
    dy?: number;
    zoomDelta?: number;
    zoomX?: number;
    zoomY?: number;
    dirty?: boolean;
  },
  animation?: boolean | ElementAnimateConfig
) {
  const { target, zoomLimit, axes } = controllerHost;
  // Store original zoom for restoration
  const originControllerHostZoom = controllerHost.zoom;
  // Calculate zoomScale
  controllerHost.zoom = controllerHost.zoom || 1;
  let newZoom = controllerHost.zoom;
  newZoom *= zoomDelta;
  if (zoomLimit) {
    const zoomMin = zoomLimit.min || 0;
    const zoomMax = zoomLimit.max || Infinity;
    newZoom = Math.max(Math.min(zoomMax, newZoom), zoomMin);
  }

  const zoomScale = newZoom / controllerHost.zoom;
  // Keep the mouse center when scaling
  controllerHost.zoom = newZoom;

  // Specify transform functions for different types of elements
  const zoomFnMap = {
    axisLine: getAxisLineZoomTransform,
    splitLine: getLineZoomTransform,
    tick: getLineZoomTransform,
    label: getLabelZoomTransform,
  };

  // Collect elements by category
  const elementArr: {
    type: 'axisLine' | 'splitLine' | 'tick' | 'label';
    el: GraphicType.Line | GraphicType.Text;
  }[] = [];

  // Collect various contents
  target.traverse((d) => {
    if (!d.anid) {
      return;
    }

    // Axis line
    if (d.anid === 'line') {
      elementArr.push({
        type: 'axisLine',
        el: d as unknown as GraphicType.Line,
      });
      return;
    }

    // Split lines and axis lines
    if (d.anid.includes('line')) {
      elementArr.push({
        type: 'splitLine',
        el: d as unknown as GraphicType.Line,
      });
      return;
    }

    // tick
    if (d.anid.includes('tick')) {
      elementArr.push({
        type: 'tick',
        el: d as unknown as GraphicType.Line,
      });
      return;
    }

    // label
    if (d.anid.includes('label')) {
      elementArr.push({
        type: 'label',
        el: d as unknown as GraphicType.Text,
      });
    }
  });

  // Record initial values
  const originTransform: {
    el: GraphicType.Line | GraphicType.Text;
    x: number;
    y: number;
    scaleX: number;
    scaleY: number;
  }[] = [];

  // Calculate transform variables for pan and zoom of different elements
  elementArr.forEach((d) => {
    const { type, el } = d;

    // Record original values
    originTransform.push({
      el,
      x: el.x,
      y: el.y,
      scaleX: el.scaleX,
      scaleY: el.scaleY,
    });

    // Calculate transforms to be applied
    const panTransform = getElementPanTransform(axes, dx, dy);
    const zoomTransform = zoomFnMap[type](
      el as any,
      zoomScale,
      zoomX,
      zoomY,
      axes
    );
    const transform = {
      x: panTransform.x + zoomTransform.x,
      y: panTransform.y + zoomTransform.y,
      scaleX: zoomTransform.scaleX,
      scaleY: zoomTransform.scaleY,
    };

    if (!animation) {
      el.x += transform.x;
      el.y += transform.y;
      el.scaleX *= transform.scaleX;
      el.scaleY *= transform.scaleY;
    } else {
      el.animateTo(transform, animation === true ? {} : animation);
    }
  });

  if (!animation && dirty) {
    target.dirty();
  }

  return () => {
    controllerHost.zoom = originControllerHostZoom;
    originTransform.forEach((d) => {
      const { el } = d;
      el.x = d.x;
      el.y = d.y;
      el.scaleX = d.scaleX;
      el.scaleY = d.scaleY;
    });
  };
}

function getElementPanTransform(
  axes: 'xAxis' | 'yAxis',
  dx: number,
  dy: number
) {
  return {
    x: axes === 'xAxis' ? dx : 0,
    y: axes === 'yAxis' ? dy : 0,
  };
}

function getAxisLineZoomTransform(
  axisLine: GraphicType.Line,
  zoomScale: number,
  zoomX: number,
  zoomY: number,
  axes: 'xAxis' | 'yAxis'
) {
  return {
    x: axes === 'xAxis' ? (axisLine.x - zoomX) * (zoomScale - 1) : 0,
    y: axes === 'yAxis' ? (axisLine.y - zoomY) * (zoomScale - 1) : 0,
    scaleX: axes === 'xAxis' ? zoomScale : 1,
    scaleY: axes === 'yAxis' ? zoomScale : 1,
  };
}

function getLineZoomTransform(
  splitLine: GraphicType.Line,
  zoomScale: number,
  zoomX: number,
  zoomY: number,
  axes: 'xAxis' | 'yAxis'
) {
  return {
    x:
      axes === 'xAxis'
        ? (splitLine.x + splitLine.shape.x1 - zoomX) * (zoomScale - 1)
        : 0,
    y:
      axes === 'yAxis'
        ? (splitLine.y + splitLine.shape.y1 - zoomY) * (zoomScale - 1)
        : 0,
    scaleX: 1,
    scaleY: 1,
  };
}

function getLabelZoomTransform(
  label: GraphicType.Text,
  zoomScale: number,
  zoomX: number,
  zoomY: number,
  axes: 'xAxis' | 'yAxis'
) {
  return {
    x: axes === 'xAxis' ? (label.x - zoomX) * (zoomScale - 1) : 0,
    y: axes === 'yAxis' ? (label.y - zoomY) * (zoomScale - 1) : 0,
    scaleX: 1,
    scaleY: 1,
  };
}
Final Result
